South Africans increasingly dissatisfied with their elected leaders’ performance
Institute for Justice and Reconciliation - AfroBarometer
Afrobarometer Dispatch No. 65 | Rorisang Lekalake
Summary
2015 has been a tumultuous year for South Africa’s democracy. A number of key government officials have been embroiled in corruption scandals, most notably the alleged mismanagement of state funds in the construction of President Jacob Zuma’s private residence in Nkandla, KwaZulu-Natal.
An investigation led by the Public Protector found that state funds were employed for non-security installations and determined that the president should repay “a reasonable percentage” of these costs (Public Protector of South Africa, 2014). While civic groups called for greater government accountability, opposition demands for President Zuma to account to the National Assembly and reimburse the state led to numerous clashes, and parliamentary security had to be called during last February’s State of the Nation address.
While the corruption scandal awaits resolution in the courts – and the headlines – student protests have succeeded in forcing the government, already plagued by mediocre news on the economic and unemployment fronts, to accept a freeze on higher education tuition for 2016.
Data from the 2015 Afrobarometer survey suggest that elected leaders may not escape unscathed by the year’s events. Public approval of the performance of the president, members of Parliament (MPs), and local government councillors has declined. The president’s approval rating is at its lowest level since 2000, well below the regional average for presidents. Unsurprisingly, public approval is generally higher in rural areas and among black South Africans, the ANC’s traditional electorate.
Interestingly, citizens increasingly believe that voters, rather than political actors, should be responsible for making sure that leaders do their jobs. Given these findings and the successes of recent student protests in securing a higher education tuition freeze for 2016, South Africans may increasingly turn to direct civic action to achieve their objectives.
Afrobarometer survey
Afrobarometer is a pan-African, non-partisan research network that conducts public attitude surveys on democracy, governance, economic conditions, and related issues across more than 30 countries in Africa. Five rounds of surveys were conducted between 1999 and 2013, and Round 6 surveys are currently under way (2014-2015). Afrobarometer conducts face-to- face interviews in the language of the respondent’s choice with nationally representative samples of between 1,200 and 2,400 respondents.
The Afrobarometer team in South Africa, led by the Institute for Justice and Reconciliation (IJR) and Plus 94 Research, interviewed 2,400 adult South Africans in August-September 2015. A sample of this size yields country-level results with a margin of error of +/-2% at a 95% confidence level. Previous surveys have been conducted in South Africa in 2000, 2002, 2004, 2006, 2008, and 2011.
Key findings
South Africans are generally dissatisfied with their elected leaders’ performance in the past year. President Zuma and local government councillors receive the lowest approval ratings (only 36% of respondents “approve” or “strongly approve”), followed by MPs (42%), while provincial leaders enjoy the highest levels (53%).
Public disapproval of elected leaders’ performance has increased significantly since 2011 for the president (by 28 percentage points), MPs (16 points), and local government councillors (10 points). Cross-country comparisons show that all three measures are above the regional average.
Urban residents, Indian/South Asian citizens, and non-ANC supporters are generally more critical of presidential and MP performance than rural residents, other racial groups, and ANC supporters. Levels of approval are similar across age groups and genders.
Since 2006, citizens increasingly believe that voters should be responsible for ensuring that leaders do their jobs.
Approval of public leaders declines
South Africans’ evaluations of overall government performance has declined significantly in a number of key areas, including management of the economy, crime/security, and the fight against corruption (see Afrobarometer Dispatch No. 64 at www.afrobarometer.org).
Given this perceived failure to address key economic challenges, it is unsurprising that public approval of elected leaders’ performance has also dropped.
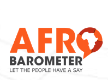
Approval of President Zuma’s performance almost halved between 2011 (64%) and 2015 (36%) and is now well below the presidential average since 2000 (55%). This is the first time that a majority of South Africans have expressed outright disapproval of a president’s performance (62%) since the initial Afrobarometer survey in 2000.
On average across years, 63% of South Africans approved of former President Thabo Mbeki’s performance between 2000 and 2006, compared to a 2011-2015 average of 50% for President Zuma. Furthermore, approval ratings increased significantly over Mbeki’s tenure, from 51% in 2000 to 77% in 2006 (Figure 1).1
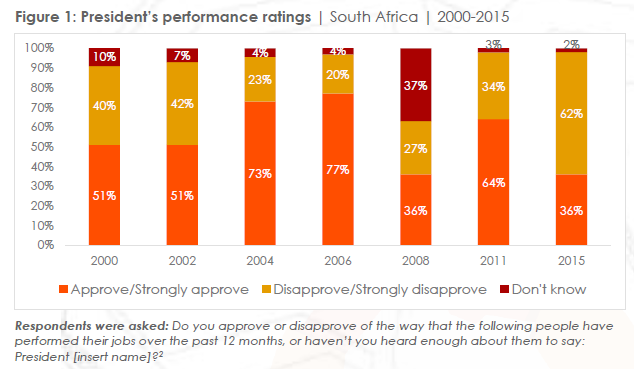
On average, half (50%) of South Africans have approved of their MP’s performance since 2000, and the trend in citizens’ evaluations during that time period largely mirrors that of the president. At present, only four in 10 South Africans (42%) “approve” or “strongly approve” of their MP’s performance, a decrease of 12 percentage points since 2011 (Figure 2).
***
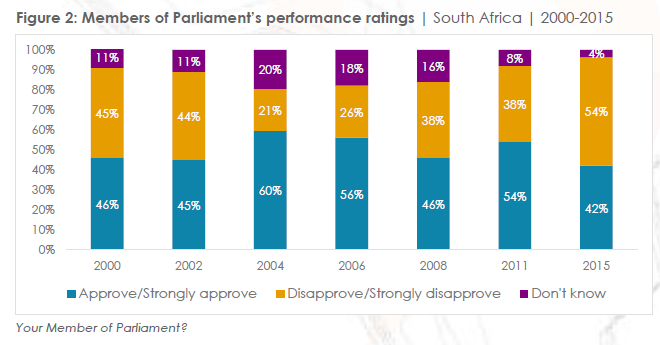
South Africa is a federal state, comprising nine provincial governments, each led by a premier. In contrast to the president and MPs, approval ratings of provincial leaders did not change significantly from the last survey round. A majority of South Africans (53%) continue to approve of their respective premier’s performance (compared to 54% in 2011), although this is lower than approval levels in 2004 and 2006 (Figure 3). Disaggregation by province indicates that residents of KwaZulu-Natal are the least dissatisfied, with only 24% saying they “disapprove” or “strongly disapprove,” followed by the Western Cape (34%) and Gauteng (34%) (see Appendix B, Table 3, for a breakdown by province).
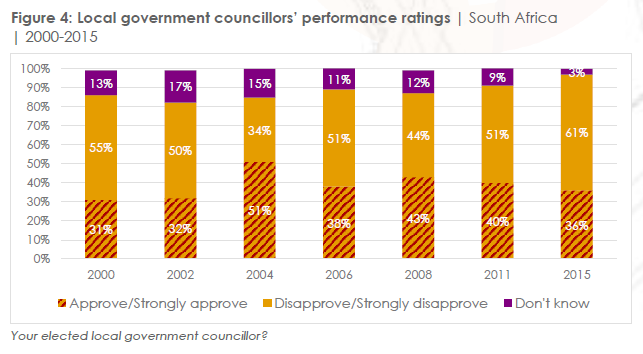
South Africans are generally more critical of their elected local government leaders than of any other leadership category: On average, less than four in 10 (39%) have “approved” or “strongly approved” of their performance since 2000. Dissatisfaction with elected representatives has been gradually growing since 2008, from 44% to 51% in 2011 and 61% in 2015 (Figure 4).
Interestingly, local government elections are the only case in which citizens vote directly for a majority of their representatives, which may encourage critical appraisal. MPs and members of provincial legislatures are chosen from party lists, and the leader of the majority party is then elected president by the National Assembly. The Van Zyl Slabbert Commission on Electoral Reform Report (January 2003) recommended that the local government election mixed-member system be extended to provincial and national levels, but this recommendation was not implemented.
***
South Africans are among the most critical citizens in the region
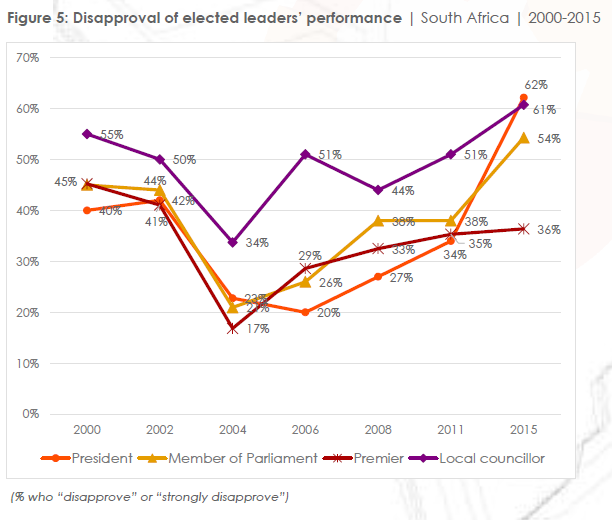
As Figure 5 shows, South Africans’ disapproval of various categories of elected leaders has followed more or less the same trend since 2000, dipping between 2000 and 2004 before gradually rising after 2006. Although citizens have generally been most dissatisfied with their local government councillors, the significant increases in disapproval of the performance of President Zuma and MPs between 2011 and 2015 have led to some convergence of these measures. At present, a majority of South Africans disapprove of the performance of the president (62%), local councillors (61%), and MPs (54%) during the past year. Disapproval of the nine premiers is significantly lower (at 34%, on average since 2000) and has been relatively stable since 2008.
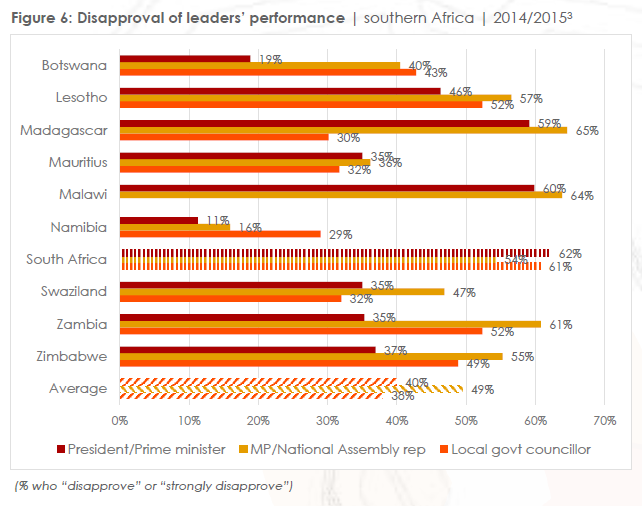
A comparison to other countries in southern Africa shows that South Africans’ evaluations are among the most critical in the region, while Namibians are the most satisfied with their leaders’ performance (Figure 6). Disapproval ratings in South Africa are significantly above the regional average for local government councillors (by 23 percentage points) and the president (22 points), while that for MPs is only slightly higher (5 points). Malawians were similarly dissatisfied with their leaders prior to last year’s election: Six in 10 disapproved of then-President Joyce Banda (60%) and their MPs (64%) in March 2014.
***
Urban residents, Indian citizens, and opposition supporters are most critical
Disaggregation of the data by demographic attributes reveals significant differences by residence location, race, and party affiliation, but not by age or gender (see Appendix B for detailed data).4
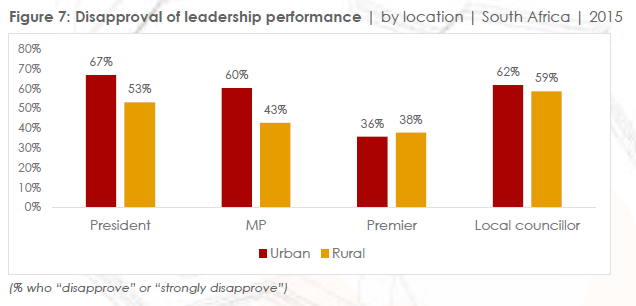
Urban residents are more critical than their rural counterparts of the performance of their MPs (by 17 percentage points) and President Zuma (14 points), while differences regarding local councillors and premiers are negligible (Figure 7).
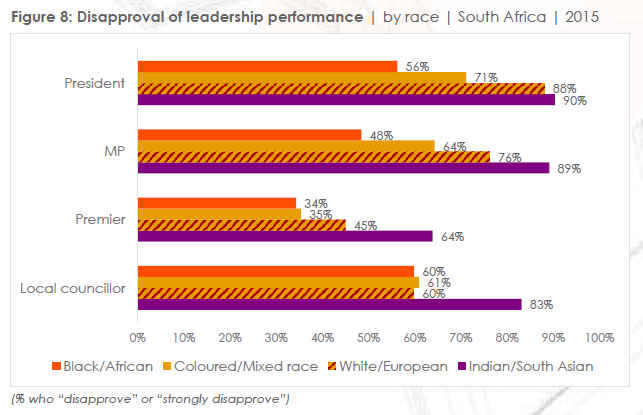
Analysis by race demonstrates that black South Africans are the least critical of leaders’ performance across the board. Nonetheless, a majority of black respondents “disapprove” or “strongly disapprove” of the performance of both President Zuma (56%) and their local councillors (60%). Indian/South Asian citizens are consistently the most critical, even in the case of local government councillors (83% disapproval, compared to an average of 60% among black, white, and coloured citizens) (Figure 8).
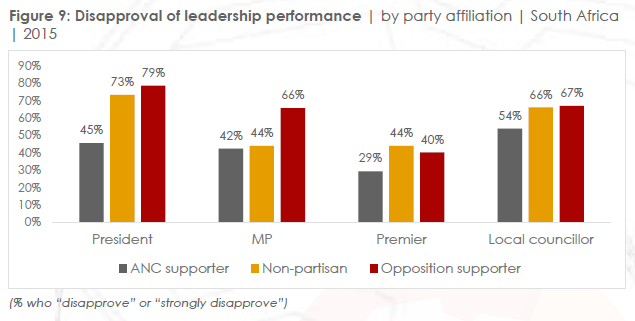
Unsurprisingly, analysis by reported party affiliation shows that ANC supporters are significantly less critical than those who support opposition parties (Figure 9).5 Only 45% of ANC supporters disapprove of the president’s performance, for example, compared to 79% of opposition supporters. The gaps are slightly smaller for MPs (24 percentage points), local government councillors (13 points), and premiers (11 points). Non-partisan citizens’ evaluations are generally similar to those of opposition supporters, except in the case of MPs.
***
***
South Africans increasingly believe they should oversee elected leaders
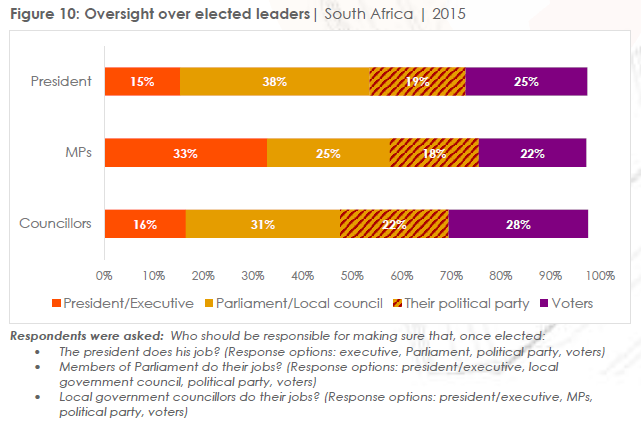
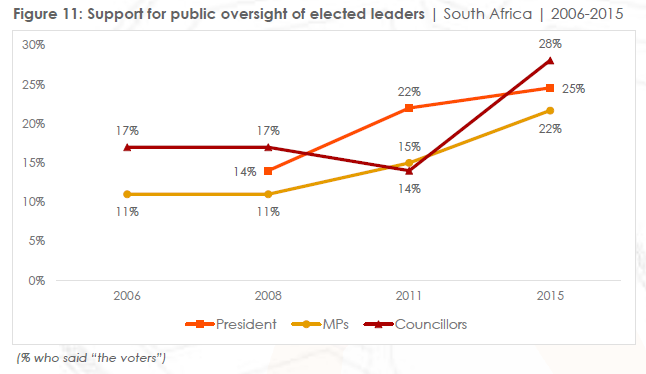
A majority of South Africans believe that the different branches of government should oversee each other’s work. Four in 10 respondents (38%) say the legislature should hold the president accountable, compared to 19% who believe that the ANC should do so and 15% who say the executive. However, about one-fourth of South Africans believe that voters themselves should hold elected leaders accountable for their performance (Figure 10). The share of citizens who believe that voters should be responsible for making sure that elected leaders do their jobs has increased significantly over the past decade (Figure 11).
***
Conclusion
Citizens’ evaluations of their elected leaders’ performance suggest that South Africans hold them responsible for the country’s recent economic and political difficulties. President Zuma, members of Parliament, and local government officials have all experienced a significant decline in approval ratings since 2011; only ratings for provincial leaders remain stable. South Africans are currently the most dissatisfied citizens in the region, and citizens increasingly believe that they should be responsible for making sure that elected leaders do their jobs.
This rise in critical citizenship and increasing willingness to take primary oversight over elected officials’ performances may be an indication of more direct civic engagement in the future.
To further explore this data, please visit Afrobarometer's online data analysis facility at www.afrobarometer.org/online-data-analysis.
Rorisang Lekalake is Afrobarometer assistant project manager for southern Africa, based at the Institute for Justice and Reconciliation in Cape Town, South Africa. Email: [email protected].
Afrobarometer is produced collaboratively by social scientists from more than 30 African countries. Coordination is provided by the Center for Democratic Development (CDD) in Ghana, the Institute for Justice and Reconciliation (IJR) in South Africa, the Institute for Development Studies (IDS) at the University of Nairobi in Kenya, and the Institute for Empirical Research in Political Economy (IREEP) in Benin. Michigan State University (MSU) and the University of Cape Town (UCT) provide technical support to the network.
Core support for Afrobarometer Rounds 5 and 6 has been provided by the UK’s Department for International Development (DFID), the Mo Ibrahim Foundation, the Swedish International Development Cooperation Agency (SIDA), the United States Agency for International Development (USAID), and the World Bank.
For more information, please visit www.afrobarometer.org.
Afrobarometer Dispatch No. 65 | 24 November 2015
References
Public Protector of South Africa. (2014). Secure in comfort: Report on an investigation into allegations of impropriety and unethical conduct relating to the installation and implementation of security measures by the Department of Public Works at and in respect of the private residence of President Jacob Zuma at Nkandla in the KwaZulu-Natal province. Available here.
Footnotes:
1 It is important to note, however, that only two surveys have been conducted under President Zuma’s tenure and that neither was held in the early years (2009-2010).
2 The 2008 survey referred to President Kgalema Motlhanthe, who had only been in office for a short time, hence the high proportion of respondents who felt unable to answer the question (37%).
3 A Round 6 survey was also conducted in Mozambique, but the data were not available at the time of publication (see Appendix A for data from all available countries). The question on local government councillors is not asked in Malawi.
4 Note that given the smaller sample size of demographic and political subgroups, these findings have significantly larger margins of sampling error than the +/-2% margin for the overall survey.
5 Survey respondents were asked whether they feel “close” to any political party and if so, to which one. Overall, 45% say they support the ANC, while 25% say they support an opposition party, and 30% say they do not feel close to any party or refused to answer.
Appendix A containing cross-national comparisons can be found here – PDF.
Appendix B: South African performance ratings by selected indicators
Table 1: Leadership performance | by urban/rural location | South Africa | 2015
|
|
Approve/ Strongly approve |
Disapprove/ Strongly disapprove |
Don't know/Haven't heard enough |
|
President |
|||
|
Urban |
31% |
67% |
2% |
|
Rural |
45% |
53% |
2% |
|
Member of Parliament |
|||
|
Urban |
37% |
60% |
3% |
|
Rural |
53% |
43% |
5% |
|
Premier |
|||
|
Urban |
52% |
36% |
12% |
|
Rural |
55% |
38% |
7% |
|
Local government councillor |
|||
|
Urban |
34% |
62% |
4% |
|
Rural |
40% |
59% |
2% |
***
Table 2: Leadership performance | by gender | South Africa | 2015
|
|
Approve/ Strongly approve |
Disapprove/ Strongly disapprove |
Don't know/Haven't heard enough |
|
President |
|||
|
Male |
36% |
63% |
1% |
|
Female |
36% |
61% |
2% |
|
Member of Parliament |
|||
|
Male |
43% |
54% |
3% |
|
Female |
41% |
55% |
4% |
|
Premier |
|||
|
Male |
53% |
38% |
9% |
|
Female |
54% |
35% |
11% |
|
Local government councillor |
|||
|
Male |
37% |
60% |
4% |
|
Female |
35% |
62% |
3% |
***
Table 3: Leadership performance | by province | South Africa | 2015
|
|
Approve/ Strongly approve |
Disapprove/ Strongly disapprove |
Don't know/ Haven't heard enough |
|
President |
|||
|
Eastern Cape |
39% |
60% |
1% |
|
Free State |
31% |
67% |
2% |
|
Gauteng |
23% |
76% |
2% |
|
KwaZulu-Natal |
56% |
39% |
5% |
|
Limpopo |
28% |
72% |
0% |
|
Mpumalanga |
50% |
50% |
0% |
|
North West |
33% |
67% |
0% |
|
Northern Cape |
23% |
75% |
2% |
|
Western Cape |
31% |
66% |
3% |
|
Members of Parliament |
|||
|
Eastern Cape |
47% |
48% |
5% |
|
Free State |
23% |
73% |
4% |
|
Gauteng |
34% |
65% |
1% |
|
KwaZulu-Natal |
52% |
43% |
5% |
|
Limpopo |
52% |
44% |
3% |
|
Mpumalanga |
55% |
42% |
2% |
|
North West |
36% |
53% |
11% |
|
Northern Cape |
40% |
57% |
4% |
|
Western Cape |
33% |
65% |
3% |
|
Premiers |
|||
|
Eastern Cape |
44% |
42% |
15% |
|
Free State |
55% |
44% |
2% |
|
Gauteng |
52% |
34% |
15% |
|
KwaZulu-Natal |
60% |
24% |
15% |
|
Limpopo |
59% |
46% |
4% |
|
Mpumalanga |
51% |
45% |
4% |
|
North West |
51% |
44% |
5% |
|
Northern Cape |
51% |
43% |
6% |
|
Western Cape |
62% |
34% |
5% |
|
Local government councillors |
|||
|
Eastern Cape |
34% |
62% |
3% |
|
Free State |
29% |
68% |
3% |
|
Gauteng |
31% |
63% |
5% |
|
KwaZulu-Natal |
45% |
53% |
3% |
|
Limpopo |
33% |
66% |
1% |
|
Mpumalanga |
30% |
68% |
2% |
|
North West |
35% |
64% |
1% |
|
Northern Cape |
35% |
62% |
4% |
|
Western Cape |
42% |
53% |
5% |
***
Table 4: Leadership performance | by age group | South Africa | 2015
|
|
Approve/ Strongly approve |
Disapprove/ Strongly disapprove |
Don't know/ Haven't heard enough |
|
President |
|||
|
18-29 years |
34% |
64% |
2% |
|
30-49 years |
36% |
62% |
2% |
|
50 years and older |
61% |
38% |
2% |
|
Members of Parliament |
|||
|
18-29 years |
42% |
54% |
3% |
|
30-49 years |
43% |
54% |
3% |
|
50 years and older |
41% |
55% |
5% |
|
Premiers |
|||
|
18-29 years |
55% |
34% |
11% |
|
30-49 years |
54% |
37% |
9% |
|
50 years and older |
51% |
38% |
11% |
|
Local government councillors |
|||
|
18-29 years |
34% |
62% |
4% |
|
30-49 years |
37% |
60% |
3% |
|
50 years and older |
36% |
61% |
3% |
***
Table 5: Leadership performance | by race | South Africa | 2015
|
|
Approve/ Strongly approve |
Disapprove/ Strongly disapprove |
Don't know/ Haven't heard enough |
|
President |
|||
|
Black/African |
42% |
56% |
2% |
|
White/European |
11% |
88% |
1% |
|
Coloured/Mixed race |
27% |
71% |
1% |
|
Indian/South Asian |
8% |
90% |
1% |
|
Members of Parliament |
|||
|
Black/African |
47% |
48% |
4% |
|
White/European |
23% |
76% |
1% |
|
Coloured/Mixed race |
33% |
64% |
3% |
|
Indian/South Asian |
10% |
89% |
1% |
|
Premiers |
|||
|
Black/African |
56% |
34% |
9% |
|
White/European |
44% |
45% |
11% |
|
Coloured/Mixed race |
54% |
35% |
10% |
|
Indian/South Asian |
12% |
64% |
24% |
|
Local government councillors |
|||
|
Black/African |
38% |
60% |
3% |
|
White/European |
32% |
60% |
8% |
|
Coloured/Mixed race |
34% |
61% |
5% |
|
Indian/South Asian |
14% |
83% |
2% |
***
Table 6: Leadership performance | by party affiliation | South Africa | 2015
|
|
Approve/ Strongly approve |
Disapprove/ Strongly disapprove |
Don't know/ Haven't heard enough |
|
President |
|||
|
ANC supporter |
53% |
45% |
2% |
|
Opposition supporter |
20% |
79% |
1% |
|
Non-partisan |
24% |
73% |
3% |
|
Members of Parliament |
|||
|
ANC supporter |
54% |
42% |
4% |
|
Opposition supporter |
32% |
66% |
2% |
|
Non-partisan |
31% |
64% |
5% |
|
Premiers |
|||
|
ANC supporter |
62% |
29% |
9% |
|
Opposition supporter |
53% |
40% |
7% |
|
Non-partisan |
41% |
44% |
15% |
|
Local government councillors |
|||
|
ANC supporter |
44% |
54% |
2% |
|
Opposition supporter |
30% |
67% |
3% |
|
Non-partisan |
28% |
66% |
6% |
The original PDF version of this report can be found – here.
Issued by AfroBarometer and the Institute for Justice and Reconciliation, 24 November 2015
