
In South Africa today, almost everyone has an opinion about education and schooling. Some people think there have been vast improvements since 1994, while others believe that much of the system is worse than the Bantu education of apartheid [1]. Rather than talk about my opinion or the opinions of others, I am going to talk about the facts. What do the facts say about how the South African education system is performing? And how has it changed since 1994?
Although there are many elements of education and schooling, the three that I'll focus on are 1) public expenditure on education, 2) access to education and most importantly, 3) the quality of schooling in South Africa.
Education Expenditures (1994-2011)
The post-apartheid government inherited a divided and highly unequal education system. Nowhere was this inequality more prevalent than in the racial differences in spending per child. Even though racial differences in spending were reduced significantly in the years leading up to 1994, the amount spent per student in a white school was two and a half times larger than on black children in urban areas and five times larger than black students in the most impoverished homeland[2]. The government immediately began equalizing expenditures and educational expenditures are now relatively equally distributed across the provinces (see Figure 1).
By 2011 Limpopo had the highest public expenditure per pupil in the country. The large increase from 2005/6 to 2010/11 is attributable to the Occupation Specific Dispensation (OSD) introduced in 2007 which raised teacher salaries significantly. It is important to remember that while the government has equalized public expenditures across provinces, in wealthier provinces private funding through school fees will contribute more to resources available at the school level than in poorer provinces.
Figure 1 Spending on public ordinary schools per public school per learner by province in 1001/2 and 2010/11 (in current Rand)
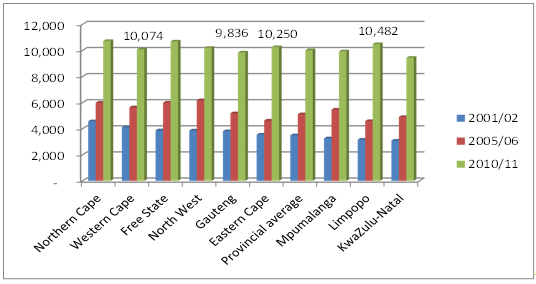
(Source: Oxford Policy Management & Stellenbosch Economics, 2012)
As of 2010/11, government expenditure on education was the largest single line item in the budget, standing at 20% of the budget and 6% of GDP. Given the labour-intensive nature of schooling, the vast majority (78%) of the education budget goes to personnel expenditures, mainly teacher salaries (see Figure 2).
Figure 2 Public expenditure on education in 2010/11

(Source: Oxford Policy Management & Stellenbosch Economics, 2012)
Looking at government expenditures on education, the post-apartheid government has successfully managed to equalize government expenditures across provinces and has adopted a pro-poor public spending approach.
It would be remiss not to mention that educational expenditures is only one side of the coin. Additional resources are mediated by provinces and schools, both of which vary widely in their capacity to manage financial and human resources. Not all provinces or schools are equally capable of converting additional resources into better outcomes, as the recent Limpopo and Eastern Cape debacles have shown.
Access
Access to basic education has reached high levels. At least 99% of children enter formal schooling and only a few drop out in primary school. The percentage of learners enrolled in grade 1 who attended a pre-primary programme increase from 61% in 2006 to 71% in 2009[3]. In the last ten years the proportion of youths attaining grade9 has risen from 76% to 86%[4].
However, statistics on grade completion up until grade 10 are quite misleading because none of these exams are externally evaluated. The matric exam (in grade 12) is the only nationally standardised and externally evaluated exam in the schooling system[5]. Because of this, it is the only one that the public really trusts.
In many schools, passing additional grades in primary and lower secondary school is a poor indication of real learning. However, as students get to grade 10 and 11, schools start failing students because they know that they will not pass the matric exam.
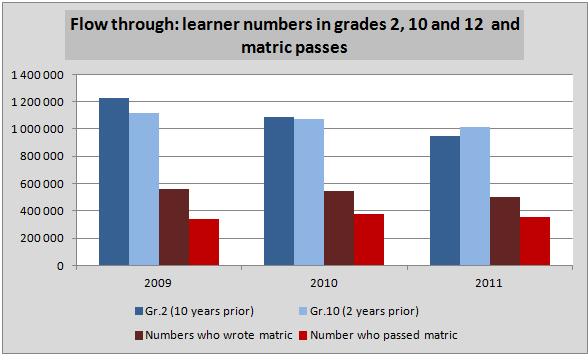
Too often we only look at the matric pass rate (what proportion of matrics pass the exam) instead of the number of students that pass matric out of the cohort that started 12 years earlier. While the matric pass rate in the past three years has hovered around 70%, this ignores the fact that about half of the total cohort has already dropped out by grade 12.
If we look instead at the students who pass matric relative to the number of students enrolled in grade 2[6] 10 years earlier, the figures are much more startling. Out of all the students that were in grade 2 in 2001, only 38% passed matric in 2011. As we can see in Figure 3, the vast majority of drop out takes place between grade 10 and grade 12. This is largely because there are no externally evaluated standardised exams at earlier grades such as a primary school leaving exam. This has been pointed out by South African researchers before:
"Low quality education combined with high and lenient grade progression up until grade 11 means that when a standardised assessment occurs, i.e. the Matric examination, this serves to filter a large proportion of weak students out of further attainment. Many of those who do attain a Matric Certificate are still not able to gain entrance into tertiary institutions. Therefore, low-quality education up until grade 11 can be regarded as the root cause of low attainment beyond grade 11." (Van der Berg et al, 2011: 4)
If we delve deeper into the performance of the minority of students that actually pass matric, the inequalities are glaringly obvious. In the poorest 80% of schools, only 1% of learners in grade 8 will go on to pass matric and obtain a C symbol or higher (60%) for Mathematics and Phyiscal Science (the prerequisite for most mathematical or science degree programs at university).
Approximately ten times as many students reach this level in the wealthiest 20% of schools. Looking at the differences by race, in 2007 just over 1% of all black matric candidates qualified for admission to mathematical and scientific degree programmes, compared to 15% of their white counterparts[7].
Given that less than half of the Grade 1 Black cohort actually make it to matric, we can say that less than 1 in 200 Black children enrolled in Grade 1 went on to pass matric and be eligible for a maths or science degree at university[8].
Quality
The high dropout in grade 11 and 12 is largely due to the fact that students are not acquiring the foundational skills they should be in earlier grades. Consequently, problems with matric performance, and dropout just before matric, are actually rooted in weak learning in primary school and early secondary school. Students carry their learning deficits with them as they get pushed through the grades only to fail in grade 10, 11 or 12 since schools do not want high failure rates in matric. The real problem lies in earlier grades.
Primary schooling
If we look at the performance of South African primary schools in international and regional context, the results are a source of national shame. South Africa participates in a number of international assessments where students from different countries write the same test so that it becomes possible to compare learning outcomes across countries. I will provide a summary of the three most recent cross-national assessments and a few salient points from each study:
The Trends in International Mathematics and Science Study (TIMSS 2003) tested grade 8 students in 50 countries in maths and science. Of the 50 countries that participated, including 6 African countries, South Africa came last.
The Progress in Reading and Literacy Study (PIRLS 2006) tested Grade 4 and 5 children in 45 countries in reading literacy. Out of the 45 participating countries (including other middle income countries like Botswana and Morocco) South Africa came last. In South Africa, only 13% of Grade 4 and 22% of Grade 5 learners reached the Low International Benchmark of 400. This is in stark contrast to the majority of other participating countries. In half of the participating countries, 94% of learners reached this Low International Benchmark. 87% of grade 4 and 78% of grade 5 learners were deemed to be "at serious risk of not learning to read"[9]
The Southern African Consortium for Monitoring Educational Quality (SAMCEQ 2007) tested Grade 6 learners from 14 African countries in reading and mathematics. Of the 15 countries that participated, South Africa came 10th for reading and 8th for Mathematics, behind low-income countries like Swaziland, Kenya and Tanzania.
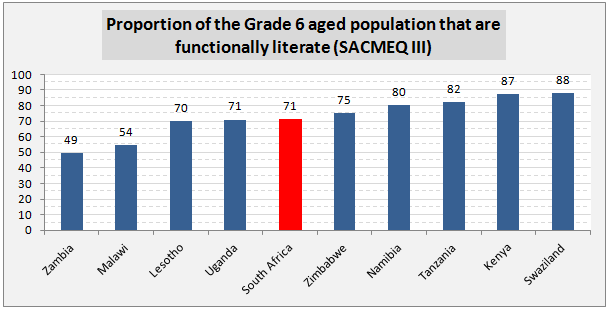
It is useful to take a closer look at South Africa's performance in the SACMEQ study since this is the most recent cross-national comparison. If we look at the proportion of students that were functionally illiterate and functionally innumerate, the prevalence is astounding. If a student is classified as functionally illiterate it means that they "cannot read a short and simple text and extract meaning" and if they are functionally innumerate it means that they "cannot translate graphical information into fractions or interpret everyday units of measurement."
Looking at the Grade 6 aged population in South Africa, 25% were deemed to be functionally illiterate, while 39% were classified as functionally innumerate. This is in stark comparison to Kenya where the rates are only 8% (functional illiteracy) and 11% (functional innumeracy). What is more striking is that South Africa spends almost five times as much per pupil ($1225) compared to Kenya ($258). On functional literacy rates, South Africa also performs worse than Namibia ($668 per child), and Swaziland ($459 per child) (see Figure 4 below).
South Africa has the same percentage of grade 6 aged children that are literate as Uganda (71%), yet spends more than 18 times as much per child! Clearly more resources is not the silver bullet - we are not using existing resources anywhere nearly as efficiently as other African countries.
Figure 4
Equity
Much of the discussion up until this point has focussed on national averages, however, in South Africa averages are uniquely misleading. They shroud the severe inequalities that plague all elements of South African life, and this is particularly true in education. It is now commonly accepted that when looking at learner performance in South Africa there is a minority of learners (roughly 25%) who attend mostly functional schools and perform acceptably on local and international tests while the majority of learners (roughly 75%) who attend dysfunctional schools perform extremely poorly on these tests[10].
Consequently, national averages overestimate the performance of the majority of South African learners since the better performing 25% of students raise the extremely low average of the bottom 75%. Because of this, the ‘average' South African learner does not exist in any meaningful sense. However misleading this measure is, the national and provincial averages of learner performance remain the most commonly reported measure of achievement in government and international reports.
Bimodality
When looking at educational datasets, this phenomenon of two education systems presents itself in the form of what is called a "bimodal distribution". Rather than having a single normal distribution of performance, where the distribution looks like a camel with one hump, there is a bimodal distribution of performance (i.e. a camel with two humps).
The bimodality of South African student performance is impervious to the grade or subject under assessment or the dataset under analysis. It can be seen as early as Grade 3[11] and remains unabated until the national school leaving exam[12]. Furthermore, the bimodality of performance can be seen not only when the sample is split by wealth quartiles (Figure 5a - SACMEQ), but also by school language (Figure 5b - PIRLS), and former education department (Figure 5c - NSES).
This is unsurprising given the strong correlations between language, socioeconomic status, and current school choice. The fact that these three figures are drawn from three independently conducted surveys at three different grades and at three different points in time further illustrates the consistency of the bimodal distribution in South Africa.
Figure 5a: Distribution of Grade 6 Reading Performance by School Wealth Quartile (Data: SACMEQ III 2007)
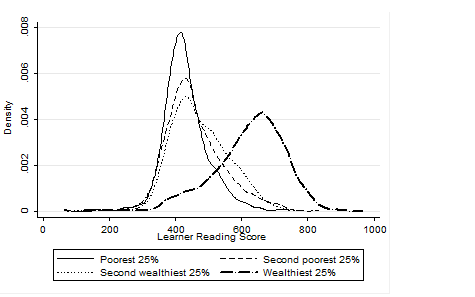
Source: Own calculations on SACMEQ III
Figure 5b: Distribution of Grade 5 Literacy Achievement by Language of School (Data: PIRLS 2006)
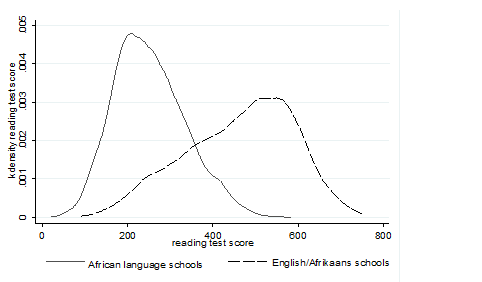
Source: Shepherd (2011)
Figure 5c: Distribution of Grade 4 Numeracy Achievement by Historical Education Department (Data: NSES 2007/8/9)
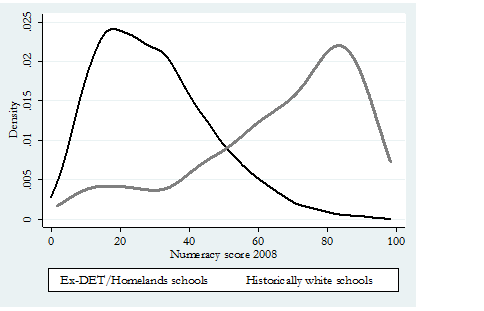
Source: (Taylor, 2011)
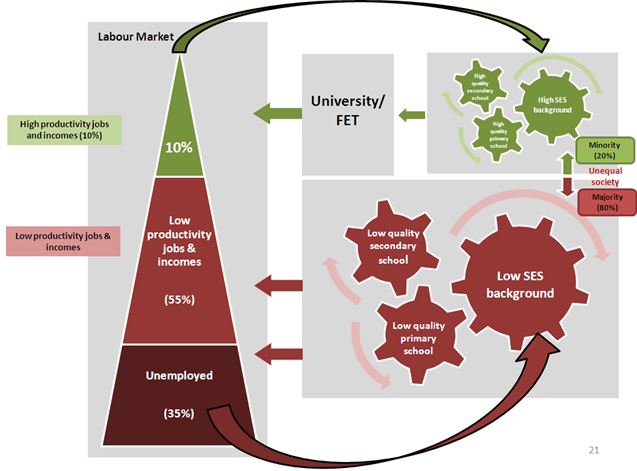
We can generalize the above findings into a theoretical framework (Figure 6). In this diagram we can see that we have two schooling systems. A minority of students (about 25%) who come from wealthy backgrounds of all races attend high quality primary and secondary schools and go on to study at University or other institutions of higher learning. Consequently these students gain access to the top end of the labour market where they earn high incomes in high productivity jobs.
The second schooling system consists of the majority of students (75%) who come from poorer backgrounds, attend low quality primary and secondary schools and have very little chance of accessing higher education opportunities due to the low quality of their education. Most of these students move directly into the labour-market either with no matric qualification or a low-quality matric pass. These students will either fill the ranks of the unemployed, the informal sector, or become part of the second-tier labour-market which offers low productivity jobs and low incomes. These jobs are often manual labour or low skill jobs which pay the minimum wage.
Due to the stratified nature of South African society, parents who are in the top end of the labour market will send their children to good schools, while those in the bottom end of the labour market will send their children to the dysfunctional part of the education system; the very system that they came through decades earlier. This cycle of inequality perpetuates the current patterns of poverty and privilege
Figure 6
Practical examples
Much of the above discussion is abstract and difficult to understand intuitively. What does it mean practically to have two education systems? What do we mean when we talk of ‘weak educational outcomes"? It is perhaps easier to understand these realities with concrete examples:
Last year (2011) the Department of Basic Education implemented the Annual National Assessments (ANA) which tested every child in grades one to six using standardised exams for each grade. This represented an important hallmark on the road to improved educational quality in the country. Although these were marked by teachers themselves, and not externally evaluated, a small sample were remarked by the HSRC. If we observe two questions from these tests, one at grade 3 and one at grade 6, the low and unequal performance become evident.
Figure 7 shows one question from the Grade 3 ANA numeracy test. It is a simple measurement question which is well within the grade 3 curriculum, yet only 40% of grade 3 students could answer this question correctly[13] (15cm). The performance across the quintiles is also highly unequal. Almost 60% of students in quintile five schools (the wealthiest 20% of schools) answered this question correctly compared to less than 40% of students in quintile one, two and three schools.
Figure 7: Question 18 from the Grade 3 Annual National Assessment 2011 (Numeracy)
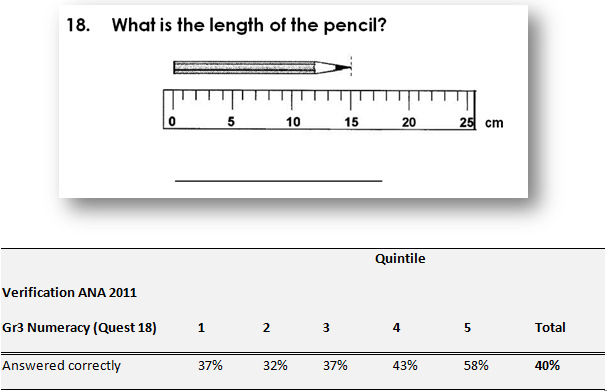
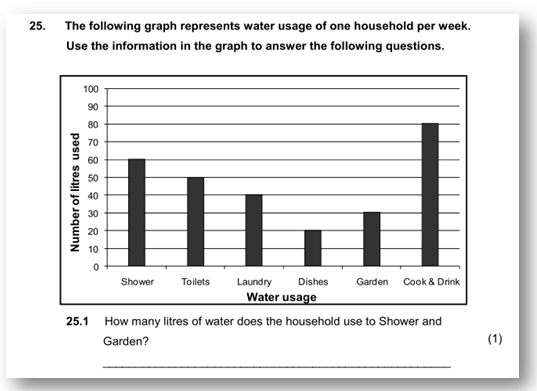
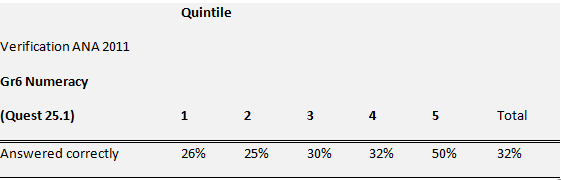
Figure 8 below shows a similar situation but now at the grade 6 level. A simple question asking for students to translate graphical information into a simple arithmetic problem, and yet only 32% of South African students could answer this correctly (90 litres). The figure was much lower for schools in quintile one and two (25% correct) compared to quintile 5 schools (50% correct). It is worth noting that only half of quintile five students could answer this question correctly showing that even our ‘better' performing schools are still not performing at the level that they should be.
Figure 8 Question 25.1 from the Grade 6 ANA 2011 (Numeracy)
Some of the causes of student underperformance
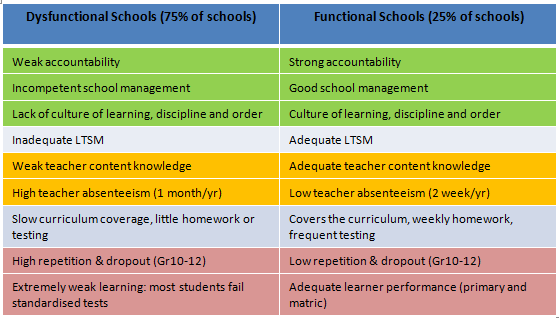
The fact that student performance in South Africa is shockingly low is now commonly accepted by most researchers in education. Some of the causes of this underperformance are also well-known (see Figure 9 below). The recent Limpopo textbook debacle is just the most recent (and unusually public) manifestation of our dysfunctional schooling system. What I want to focus on here is the teacher. Teachers are far more important than textbooks. It is perhaps obvious but worth stating: students cannot learn unless there is a teacher in the class teaching them, and secondly, teachers cannot teach what they do not know. As such I would like to turn our attention to teacher absenteeism and teacher knowledge.
Figure 9: Characteristic features of South Africa's two education systems
Teacher knowledge
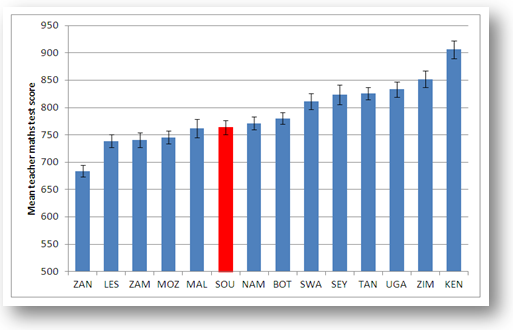
In 2007 as part of the SACMEQ III study in South Africa, grade 6 mathematics and language teachers were tested in addition to their students. Figure 10 shows that South African Grade 6 maths teachers knew less than their counterparts in 8 other African countries, sometimes significantly less.
Figure 10: SACMEQ III (2007) grade 6 Maths-teacher content knowledge
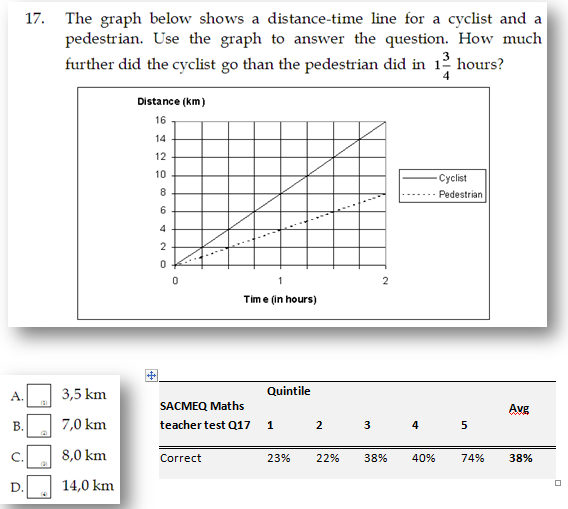
Again it may help to illustrate the point by selecting a single question. Figure 11 below shows question 17 of the mathematics test that was administered to 401[14] grade 6 mathematics teachers in the country. It is a straight-forward question testing the ability of teachers to extract graphical information and perform a simple arithmetic procedure.
The question is simple enough that it was also included in the student questionnaire. Yet only 38% of grade 6 maths-teachers could answer this correctly. Thus, it is little wonder that only 17% of their students could answer the same question correctly. Again the inequalities across school quintiles is evident. While three out of four maths teachers in quintile five schools could answer this correctly, in quintile one and two schools the rate was as low as 23% and 22% respectively. Quintile three and four teachers didn't do much better with only 40% getting the correct answer.
Figure 11: Question 17 from SACMEQ (III) Maths test administered to Grade 6 Maths-teachers
Teacher absenteeism
Teacher absenteeism is also a big problem in South African schools. The SACMEQ study of 2007 found that South Africa had the highest rate of teacher absenteeism of all 14 African countries that participated in the study. The South African average for grade 6 teacher absenteeism was 20 days, i.e. an entire month. Most of this (12 days) was due to teacher strikes.
Similar results have been found by the HSRC (2010) in their analysis of educator leave (using the Khulisa Consortium audit). They find that between 20-24 days of regular instructional time were lost due to leave in 2008. In the Department of Basic Education's 2010/2011 annual report[15] they find that "an estimated 20 teaching days per teacher were lost during the 2010 teachers' strike".
Importantly, the above figures do not include time lost where teachers were at school but not teaching scheduled lessons. A recent study observing 58 schools in the North West concluded that "Teachers did not teach 60% of the lessons they were scheduled to teach in North West" (Carnoy & Chisholm et al, 2012: xvi).
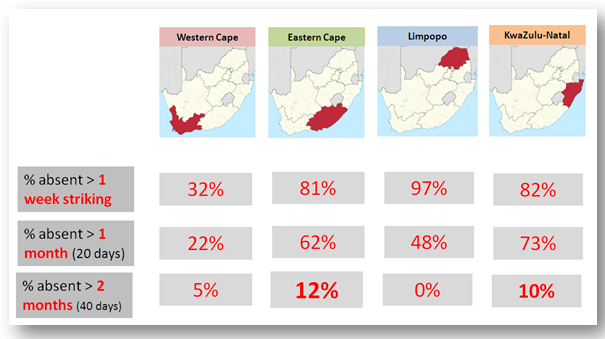
The provincial differences in teacher absenteeism are also striking. If we look at four provinces (see Figure 12) we can see the large differences between the Western Cape on the one hand and the Eastern Cape, Limpopo and KwaZulu-Natal on the other hand. The figures speak for themselves. What is truly astounding is the large proportions of teachers who were absent for an entire month. 73% of Grade 6 teachers in KwaZulu-Natal were absent for more than one month in 2007. 12% of teachers in the Eastern Cape were absent for more than 2 months, which is the equivalent of being absent for 1.3 days in a five day working week[16]. The fact that teacher absenteeism is so widespread across the country is completely unacceptable.
Figure 12: Grade 6 self-reported teacher absenteeism statistics from SACMEQ III (based on 996 teachers)
2 Significant recent improvements
Although the above statistics paint a grim picture regarding the state of education in South Africa, two recent developments indicate that the Department of Basic Education is finally taking decisive action to improve the dismal state of affairs.
The first is the roll out of the learner workbooks in 2010 and the second is the implementation of the Annual National Assessments in 2011. The aim of the learner workbooks initiative is to provide a workbook for every child for maths and language. These workbooks provide well sequenced daily worksheets intended to assist teachers with curriculum coverage.
The Annual National Assessments are a set of standardised exams at the primary grades which every learner has to write. This allows the Department to target support to schools where it is most needed and provides benchmarks for grade-appropriate assessment. Eventually these exams could be used for accountability purposes allowing the Department and parents to hold teachers and schools accountable.
However, it is imperative that at least one grade of the ANA's be externally evaluated by an independent body (like Umalusi does for matric). At the moment they are marked by teachers themselves and thus cannot be used as a reliable measure of school or teacher performance.
Selective interpretation of the facts?
Some observers may object to this portrayal of the South African education system. Some may say that it is too harsh and that things aren't really this bad. Are the above statistics a selective interpretation of the facts or a sobering presentation of the South African reality? To answer this, let me provide four quotations from eminent education researchers and respected intellectuals:
- "Our researchers found that what students know and can do is dismal" (Taylor & Vinjevold, 1999)[17]
- "Without ambiguity or the possibility of misinterpretation, the pieces together reveal the predicament of South African primary education" (Fleisch, 2008: 2)
- "Although 99.7% of South African children are in school...the outcomes in education are abysmal" (Trevor Manuel, 2011)[18]
- "It is not an overstatement to say that South African education is in crisis." (Van der Berg & Spaull, 2011)[19]
Conclusion
From the above discussion, six findings stand out:
- There have been some important successes including expanding access, equalizing spending, and recently, ANAs, workbooks and CAPS.
- We have two education systems not one. The quality of education in most South African schools is far too low - this cannot continue without social consequences.
- Equalizing resources has not equalized outcomes -there is a serious need for accountability.
- Most of South Africa performs worse than many poorer African countries - more resources is not a silver bullet.
- South Africa had the highest teacher absenteeism in 14 African countries.
- Widespread failure to get the basics right - large numbers of students (30%) are failing to acquire foundational numeracy and literacy skills
The post-apartheid government inherited a divided and mostly dysfunctional education system. While it has successfully managed to increase access, equalize government expenditures and ensure that government spending is pro-poor, on the most important task of providing all children with a basic education, irrespective of race, class or geography, it has failed dismally.
It is without question that the majority of South Africa's schooling system remains dysfunctional. Every survey that we have testifies to this fact. Most of South Africa's primary schools perform worse than poorer schools in poorer African countries. Children may be in school, but most are simply not learning what they should be.
Instead of being a ladder of social mobility, the educational system is a propagating mechanism favouring the status quo. The fact that South Africa performs worse than many low income African countries should be alarming to parents and policy-makers alike. While educational reform will not be easy, it is absolutely imperative. Improving the quality of teaching, assessment, accountability and school-management will yield large long-term benefits, particularly for the poor.
Nelson Mandela in his book "Long Walk to Freedom" famously said that "Education is the great engine of personal development. It is through education that the daughter of a peasant can become a doctor, that the son of a mineworker can become the head of the mine, that a child of farm-workers can become the president"
South Africa simply does not have that type of education.
It is unfortunate but true that the current educational system lacks the ability to educate most of the youth in South Africa. It is not effective. It is not efficient. It is not fair. Until such a time as the education system in South Africa can provide a quality education to all learners, not only the wealthy, we will be stuck with the current patterns of poverty and privilege.
Nicholas Spaull is a researcher in the economics department at Stellenbosch University. His research focuses on primary schooling in South Africa and Africa. This article is based on his keynote presentation at the NAPTOSA Annual Conference on the 24th of August 2012. His website is http://nicspaull.com/ and he can be followed on Twitter here.
This article was published with the assistance of the Friedrich-Naumann-Stiftung für die Freiheit (FNF). The views presented in the article are those of the author and do not necessarily represent the views of FNF.
Footnotes:
[1] http://www.news24.com/SouthAfrica/News/Education-worse-than-under-apartheid-20120323
[2] Fiske, E., & Ladd, H. (2004). Elusive Equity: Education Reform in Post-apartheid South Africa. Washington: Brookings Institution Press / HSRC Press. (Page 102)
[3] DBE. 2011. Macro Indicators Trends 2011. Page 9
[4] Oxford Policy Management & Stellenbosch Economics, 2012
[5] Although the Annual National Assessments (ANA) were introduced in 2011 and test grades 1-6 using standardised exams, only a sample is externally evaluated.
[6] We use grade 2 rather than grade 1 because grade 1 enrolments are particularly volatile due to early enrolment and subsequent repetition in grade 1.
[7] See Moses, E. 2011. Quality of education and the labour market. SUN Working papers.
[8]Based on 2007 matric statistics
[9] Trong, K. (2010). The Relative Risk-Percentage Equity Index: Measuring Equity in Reading Achievement Across PIRLS 2006 Countries. Hamburg: International Association for the Evaluation of Education.
[10] (Fleisch, 2008)
[11] (Taylor, 2011),
[12] (Van der Berg, 2007)
[13] It is interesting to note that this is before the language switch in grade 4 - i.e. most children would have done this test in their home language. Most South African children learn in their home language up until Grade 3 and then in Grade 4 switch to either English or Afrikaans.
[14] 97 of the 498 teachers refused to write the mathematics test which is why there are only 401 observations for the South African mathe teacher test.
[15] (DBE, 2011: p18)
[16] Given that SACMEQ was done in September 2007, a maximum of 159 school days could have passed, hence 3 months = 1.3 days a week
[17] Cited in Fiske and Ladd, 2004
[18] http://www.buanews.gov.za/rss/11/11090513551001
[19] http://mg.co.za/article/2011-04-08-sa-education-the-poorest-choice/
References
Carnoy, M ., Chisholm, L and Chilisa, B et al. 2012. The Low Achievement Trap: Comparing Schooling in Botswana and South Africa. HSRC Press. Cape Town
Fiske, E., & Ladd, H. (2004). Elusive Equity: Education Reform in Post-apartheid South Africa. Washington: Brookings Institution Press / HSRC Press.
Fleisch, B. (2008). Primary Education in Crisis: Why South African schoolchildren underachieve in reading and mathematics. Cape Town. : Juta & Co.
HSRC. 2010. An investigation into educator leave in the South African ordinary public schooling system.
Oxford Policy Management and Stellenbosch Economics. 2012. Public Expenditure Analysis for the Department of Basic Education.
Shepherd, D. (2011). Constraints to School Effectiveness: What prevents poor schools from delivering results? Stellenbosch Economic Working Papers 05/11 .
Spaull, N. (2011). Primary School Performance in Botswana, Mozambique, Namibia and South Africa: A Comparative Analysis of SACMEQ III. SACMEQ Working Papers , 1-74.
Taylor, S. (2011). Uncovering Indicators of Effective School Management in South Africa using the National School Effectiveness Study. Stellenbosch Economic Working Papers .
Van der Berg, S. (2007). Apartheid's Enduring Legacy: Inequalities in Education. Journal of African Economies , 16 (5), 849-880.
Van der Berg, S., Burger, C., Burger, R., de Vos, M., du Rand, G., Gustafsson, M., Shepherd, D., Spaull, N., Taylor, S., van Broekhuizen, H., and von Fintel, D. (2011). Low quality education as a poverty trap. Stellenbosch: University of Stellenbosch, Department of Economics. Research report for the PSPPD project for Presidency
Click here to sign up to receive our free daily headline email newsletter
