JOHANNESBURG - The African National Congress has lost its two-thirds majority in parliament. According to the final results for the 2009 national elections, released by the Independent Electoral Commission on Saturday, South Africa's ruling party won 65,9% of the vote, down from 69,69% in 2004 (see here). 17,680,729 valid votes were cast in this election; just over 2 million more than the 15,612,671 cast in 2004. Voter turnout was 77,3%, up from 76,7% in 2004.
The ANC will take up 264 seats in the 400 member national assembly, 32 fewer than it held by the end of the last parliament, and three seats short of the majority needed to change the constitution unilaterally. The ANC also lost control of the Western Cape to the Democratic Alliance.
Although the ANC effectively saw off the challenge posed by the Congress of the People, this is still the first real electoral reversal the ruling party has suffered since 1994. The ANC's share of the vote declined significantly in all provinces except Mpumalanga and KwaZulu-Natal. In the Eastern Cape, Free State, Limpopo, North West and Western Cape the ANC also saw an absolute decline in the number of votes it received. In these five provinces the ANC received 783,706 fewer votes, in total, than in 2004.
Table 1: ANC's support by province - 2004 and 2009 national elections compared
|
|
2004 |
2009 |
||||
|
Provinces |
ANC votes |
All votes |
Percent |
ANC votes |
All votes |
Percent |
|
KwaZulu Natal |
1,312,767 |
2,765,203 |
47.47% |
2,256,248 |
3,527,234 |
63.97% |
|
Mpumalanga |
979,155 |
1,134,092 |
86.34% |
1,152,698 |
1,343,253 |
85.81% |
|
Gauteng |
2,408,821 |
3,504,363 |
68.74% |
2,814,277 |
4,345,613 |
64.76% |
|
Northern Cape |
222,205 |
323,201 |
68.75% |
253,264 |
414,502 |
61.10% |
|
Limpopo |
1,487,168 |
1,657,596 |
89.72% |
1,319,659 |
1,547,636 |
85.27% |
|
North West |
1,083,254 |
1,323,761 |
81.83% |
822,166 |
1,113,411 |
73.84% |
|
Free State |
838,583 |
1,022,044 |
82.05% |
756,287 |
1,051,858 |
71.90% |
|
Eastern Cape |
1,806,221 |
2,277,391 |
79.31% |
1,609,926 |
2,309,643 |
69.70% |
|
Western Cape |
742,741 |
1,605,020 |
46.28% |
666,223 |
2,027,579 |
32.86% |
|
Total |
10,880,915 |
15,612,671 |
69.69% |
11,650,748 |
17,680,729 |
65.90% |
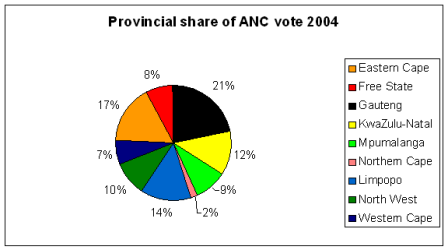
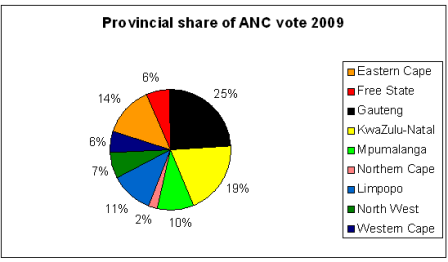
The ANC's fall in support across much of the country was substantially offset by Jacob Zuma's personal popularity among Zulu-speaking voters, particularly in KwaZulu-Natal. In Mpumalanga, Gauteng, and KZN the ANC won 1,522,480 more votes than in 2004 - with just under a million (943,481) of these coming from Zuma's home province. (The ANC's gains were largely at the expense of the IFP which received 804,260 votes (4,55%) of the total, down from 1,088,664 (6,97%) in 2004.) 53,4% of the ANC's national vote came from these three provinces, up from 42,2% in 2004 (see charts below). Overall, the ANC received 11,650,748 votes at national level, up from 10,880,915 in 2004.
The Democratic Alliance upped its number of votes nationally by fifty percent - an increase of one million. It made gains in all provinces barring Limpopo.
Table 2: DA's support by province - 2 004 and 2009 national elections compared
|
|
2004 |
2009 |
||||
|
Provinces |
DA votes |
All votes |
Percent |
DA votes |
All votes |
Percent |
|
KwaZulu Natal |
276429 |
2,765,203 |
10.00% |
364518 |
3,527,234 |
10.33% |
|
Mpumalanga |
81313 |
1,134,092 |
7.17% |
102039 |
1,343,253 |
7.60% |
|
Gauteng |
712395 |
3,504,363 |
20.33% |
924211 |
4,345,613 |
21.27% |
|
Northern Cape |
37533 |
323,201 |
11.61% |
54215 |
414,502 |
13.08% |
|
Limpopo |
63236 |
1,657,596 |
3.81% |
57418 |
1,547,636 |
3.71% |
|
North West |
72444 |
1,323,761 |
5.47% |
96850 |
1,113,411 |
8.70% |
|
Free State |
90609 |
1,022,044 |
8.87% |
127259 |
1,051,858 |
12.10% |
|
Eastern Cape |
165135 |
2,277,391 |
7.25% |
230187 |
2,309,643 |
9.97% |
|
Western Cape |
432107 |
1,605,020 |
26.92% |
989132 |
2,027,579 |
48.78% |
|
Total |
1,931,201 |
15,612,671 |
12.37% |
2,945,829 |
17,680,729 |
16.66% |
The DA's big breakthrough came in the Western Cape. On the national ballot the DA gained over half-a-million new votes in the province. It also won a 51,46% majority on the provincial ballot - which gave the party 22 out of 41 seats in the Western Cape legislature (see here). The party headed off the challenge posed by COPE, which had at one stage threatened to make serious inroads into the DA's constituency as much as it did the ANC's. COPE did however beat the DA to the position of official opposition in the Eastern Cape, Free State (by 0,01%), Limpopo, North West and Northern Cape.
COPE's inability to run an effective election campaign - due to massive underfunding relative to the ANC and organisational weaknesses - meant that its support declined as the campaign progressed, and the initial enthusiasm its launch had generated began to wear off. The party eventually won 1,311,027 votes (7,42%) on the national ballot and 30 seats in the national assembly.
Table 3: COPE's national support - by province
|
2009 |
|||
|
Provinces |
COPE votes |
All votes |
Percent |
|
KwaZulu Natal |
54,611 |
3,527,234 |
2.36% |
|
Mpumalanga |
38,802 |
1,343,253 |
2.89% |
|
Northern Cape |
66,082 |
414,502 |
15.94% |
|
Limpopo |
111,651 |
1,547,636 |
7.21% |
|
North West |
93,898 |
1,113,411 |
8.43% |
|
Free State |
116,852 |
1,051,858 |
11.11% |
|
Gauteng |
337,931 |
4,345,613 |
7.78% |
|
Eastern Cape |
307,437 |
2,309,643 |
13.31% |
|
Western Cape |
183,763 |
2,027,579 |
9.06% |
|
Total |
1,311,027 |
17,680,729 |
7.42% |
The biggest losers of the campaign were the smaller parties. The Freedom Front Plus managed to hold onto its four seats, but the ACDP, ID, UDM, PAC and UCDP all suffered severe losses.
Table 4: Support for other parties nationally - 2004 and 2009 compared
|
Year |
2004 |
2009 |
||||
|
Parties |
Votes |
% |
Seats |
Votes |
% |
Seats |
|
ACDP |
250,272 |
1.60% |
6 |
142,658 |
0.81% |
3 |
|
APC |
NA |
NA |
NA |
35,867 |
0.20% |
1 |
|
AZAPO |
39,116 |
0.25% |
1 |
38,245 |
0.22% |
1 |
|
ID |
269,765 |
1.73% |
7 |
162,915 |
0.92% |
4 |
|
MF |
55,267 |
0.35% |
2 |
43,474 |
0.25% |
1 |
|
PAC |
113,512 |
0.73% |
3 |
48,530 |
0.27% |
1 |
|
UCDP |
117,792 |
0.75% |
3 |
66,086 |
0.37% |
2 |
|
UDM |
355,717 |
2.28% |
9 |
149,680 |
0.85% |
4 |
|
VF Plus |
139,465 |
0.89% |
4 |
146,796 |
0.83% |
4 |
|
Total |
15,612,671 |
8.59% |
35 |
17,680,729 |
4.72% |
21 |
Click here to sign up to receive the free Politicsweb daily headline newsletter
