
Travel In Cities And Towns II - Statistical Overview: Evidence From The 2013 National Household Travel Survey
7 March 2018
Introduction
The previous brief in this series considered evidence about travel from the 2016 General Household Survey. This brief seeks to answer two questions:
- Does the National Household Travel Survey (the NHTS) confirm or contradict the information in the General Household Survey?
- What additional insights can be gained from the NHTS?
Travel: extent and reasons
Table 1 displays the percentage of people travelling in the seven days before the survey. The pattern is similar in metro and urban areas.
|
Table 1 - Percentage of people travelling in the last seven days, 2013 |
|
|
|
|
|
|
|
|
Metro |
Urban |
|
Yes |
85,0% |
84,1% |
|
No |
15,0% |
15,9% |
|
Total |
100,0% |
100,0% |
There are twelve reasons for travel identified in the NHTS: usual work place, in the course of work or business, visiting friends or relatives, taking someone somewhere, shops, looking for work, medical services, traditional healer, welfare offices, church and other[1]. Table 2 sets out the distribution of travellers by number of reasons for travel on the weekday travel day selected[2].
A trip is defined in the NHTS as a one way movement by a single person from origin to destination. A person traveling to and from work takes two trips. Should a family consisting of a father, mother and two children go to the shops and then return home, this will count as eight trips.
|
Table 2 - Number of reasons for travel on weekdays, 2013 |
|
|
|
Per cent |
|
|
|
|
Metro |
Urban |
|
None recorded |
1,7% |
11,0% |
|
1 |
8,9% |
71,8% |
|
2 |
70,4% |
12,4% |
|
3 |
13,6% |
3,5% |
|
4 or more |
5,4% |
1,3% |
|
Total |
100,0% |
100,0% |
Table 3 sets out the distribution of trips by purpose. Apart from returning home, the most common reason for travelling is to get to work, followed by getting to an educational institution, going to the shops and visiting friends or relatives.
|
Table 3 - Trips by purpose on weekdays, 2013 |
|
|
|
|
|
|
|
|
|
|
|
|
|
|
Metro |
Urban |
|
|
|
|
Per cent |
|
|
Usual work place |
|
17,8% |
15,1% |
|
|
In the course of work/business |
2,6% |
1,7% |
|
|
|
Visiting friends/relatives |
|
5,3% |
6,1% |
|
|
Taking someone somewhere |
2,3% |
1,8% |
|
|
|
Educational institution |
|
14,3% |
15,9% |
|
|
Shops |
|
|
7,0% |
6,6% |
|
Looking for work |
|
2,0% |
1,9% |
|
|
Medical services |
|
1,6% |
1,4% |
|
|
Traditional healer |
|
0,8% |
0,6% |
|
|
Welfare offices |
|
|
0,7% |
0,7% |
|
Church |
|
|
3,0% |
2,6% |
|
Going home |
|
|
36,8% |
41,4% |
|
Other |
|
|
2,1% |
1,6% |
|
Not recorded |
|
|
3,6% |
2,6% |
|
Total |
|
|
100,0% |
100,0% |
|
Total trips |
|
|
46 480 371 |
29 405 472 |
|
Travellers |
|
|
15 657 643 |
11 463 263 |
|
Trips/traveller |
|
|
2,97 |
2,57 |
Table 3 sets out the data as reported. If people returned home immediately after an outward trip, the proportion going home would be 50%. However, people may make multi-purpose trips such as going to work, then to the shops and then home.
Modal split
Table 4 sets out the modal split.
|
Table 4 - Modal split during weekdays, 2013 |
|
|
|
|
Metro |
Urban |
|
Metrorail |
4,7% |
0,5% |
|
Long distance train |
0,1% |
0,1% |
|
Bus |
4,2% |
3,3% |
|
BRT/IRT bus |
0,3% |
0,1% |
|
Metered taxi |
0,3% |
0,4% |
|
Local minibus taxi |
21,5% |
14,8% |
|
Long distance minibus taxi |
0,9% |
0,8% |
|
Sedan taxi |
1,5% |
0,8% |
|
Bakkie taxi |
0,9% |
0,8% |
|
Car/bakkie passenger |
11,1% |
9,6% |
|
Car/bakkie driver |
20,2% |
12,5% |
|
Truck/lorry/tractor/trailer passenger |
0,7% |
0,8% |
|
Truck/lorry/tractor/trailer driver |
0,3% |
0,3% |
|
Company vehicle |
0,9% |
2,0% |
|
Scooter/motorcycle |
0,2% |
0,2% |
|
Bicycle |
0,4% |
0,6% |
|
Animal drawn |
0,0% |
0,0% |
|
Boat/ship |
0,0% |
0,0% |
|
Aircraft |
0,1% |
0,0% |
|
Gautrain |
0,2% |
0,1% |
|
Walking all the way |
30,8% |
51,3% |
|
Other |
0,7% |
1,0% |
|
Total |
100,0% |
100,0% |
|
Trips |
37 917 154 |
25 030 593 |
|
Travellers |
15 657 643 |
11 463 263 |
|
Trips per traveller |
2,42 |
2,18 |
There is a substantial discrepancy between the total number of trips recorded by purpose and the total number of trips recorded by mode. Interviewers have not reconciled the totals for each traveller. Table 4 indicates that car travel is the most popular mode in metros, followed by walking, local minibus taxis, train and bus. By contrast, walking is the most popular mode in urban areas, followed by car travel, local minibus taxis, bus and train.
The distributions of reasons for walking all the way are set out in Table 5.
|
Table 5 - Reasons for walking all the way, weekdays |
|
|
|
|
Metro |
Urban |
|
Nearby |
73,4% |
69,3% |
|
By choice |
7,2% |
9,4% |
|
Health reasons |
0,5% |
0,4% |
|
Public transport too expensive |
6,4% |
10,5% |
|
No available public transport |
1,6% |
3,1% |
|
Not enough public transport |
0,7% |
0,8% |
|
Fuel costs |
0,4% |
0,6% |
|
To avoid traffic congestion |
0,0% |
0,1% |
|
No parking at destination |
0,3% |
0,1% |
|
Other and unspecified |
9,4% |
5,8% |
|
Total |
100,0% |
100,0% |
81% of people in metro areas walked because their destination was nearby, or by choice, or for health reasons, compared with 79% in urban areas. 9% in metros and 15% in urban areas did so because of problems with public transport or fuel costs.
The influence of household income on the modal split
Table 6 shows the influence of household income on the modal split. Households are divided nationally into five income quintiles. Walking decreases monotonically by quintile and car travel increases monotonically by quintile. The use of trains peaks in the fourth quintile. The use of buses and minibus taxis peak in the third quintile in metros and the in fourth quintile in urban areas.
|
Table 6 - Modal split by household income quintile, weekdays |
|
|
|
|
|
|
|
Quintile |
|
|
|
|
|
|
Lowest |
Second |
Third |
Fourth |
Highest |
|
Metro |
|
|
|
|
|
|
Metrorail (incl. Gautrain) |
3,3% |
4,7% |
6,4% |
7,3% |
2,6% |
|
Bus (incl. BRT/IRT bus) |
3,5% |
4,8% |
6,3% |
5,5% |
2,6% |
|
Local minibus taxi |
19,6% |
24,7% |
28,6% |
27,1% |
10,6% |
|
Car |
5,5% |
7,6% |
14,0% |
29,1% |
70,6% |
|
Walking all the way |
62,2% |
52,3% |
37,3% |
22,7% |
7,0% |
|
All other |
6,0% |
5,9% |
7,5% |
8,2% |
6,6% |
|
Total |
100,0% |
100,0% |
100,0% |
100,0% |
100,0% |
|
Urban |
|
|
|
|
|
|
Metrorail (incl. Gautrain) |
0,6% |
0,6% |
0,4% |
0,8% |
0,3% |
|
Bus (incl. BRT/IRT bus) |
2,1% |
3,3% |
4,1% |
5,1% |
2,3% |
|
Local minibus taxi |
9,5% |
12,5% |
19,7% |
20,7% |
12,2% |
|
Car |
4,2% |
7,5% |
12,8% |
29,2% |
63,5% |
|
Walking all the way |
77,7% |
69,1% |
53,4% |
35,5% |
13,2% |
|
All other |
5,8% |
7,0% |
9,6% |
8,7% |
8,4% |
|
Total |
100,0% |
100,0% |
100,0% |
100,0% |
100,0% |
Time spent travelling to work and to educational institutions
Table 7 sets out the average time taken to get from home to work or an educational institution by mode of travel.
|
Table 7 - Average time taken to work and to educational institution |
|
|
||
|
Minutes |
|
|
|
|
|
Mode |
To work |
|
To educational institution |
|
|
|
Metro |
Urban |
Metro |
Urban |
|
Train |
65 |
165 |
78 |
30 |
|
Bus |
86 |
79 |
50 |
24 |
|
Minibus taxi |
59 |
39 |
61 |
47 |
|
Car |
45 |
33 |
47 |
41 |
|
Walking |
47 |
28 |
41 |
45 |
|
All others |
51 |
28 |
47 |
53 |
|
All modes |
55 |
40 |
51 |
45 |
|
GHS estimates |
35 |
25 |
33 |
19 |
The average travel times estimated by the NHTS are considerably higher than those estimated by the GHS. Part of the explanation may be that the NHTS are based on the time from door to door, whereas the GHS estimates may refer to times spent in vehicles. But this cannot be the entire explanation, since average walking times are longer in the NHTS than in the GHS estimates.
Figure 1 displays the distribution of times taken to travel to work. The distribution is represented by an ogive (or cumulative distribution) curve. For any given time, the curves give the probability that the travel time will be less than or equal to that time. For instance, in urban areas 0.5 (or 50%) of trips to work take 34 minutes or less and in metro areas, 50% of the trips take 49 minutes or less.
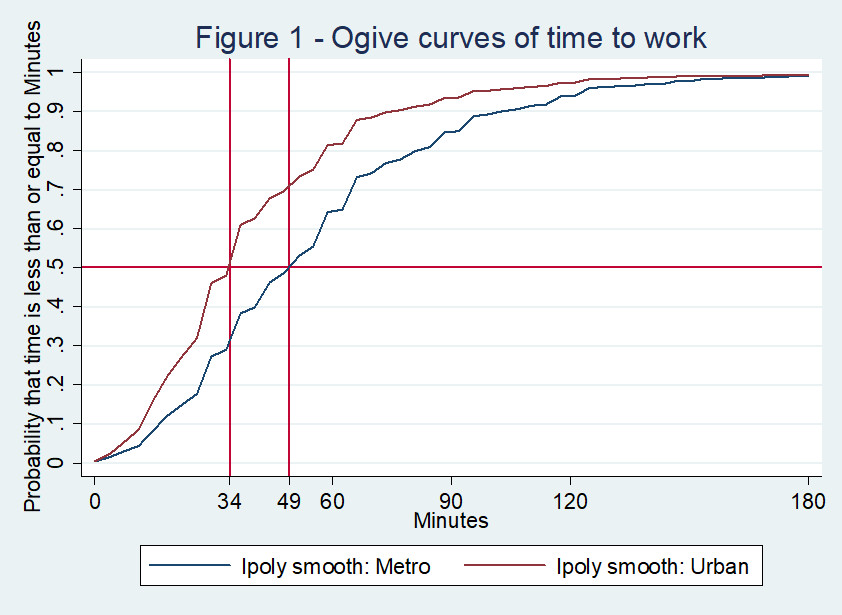
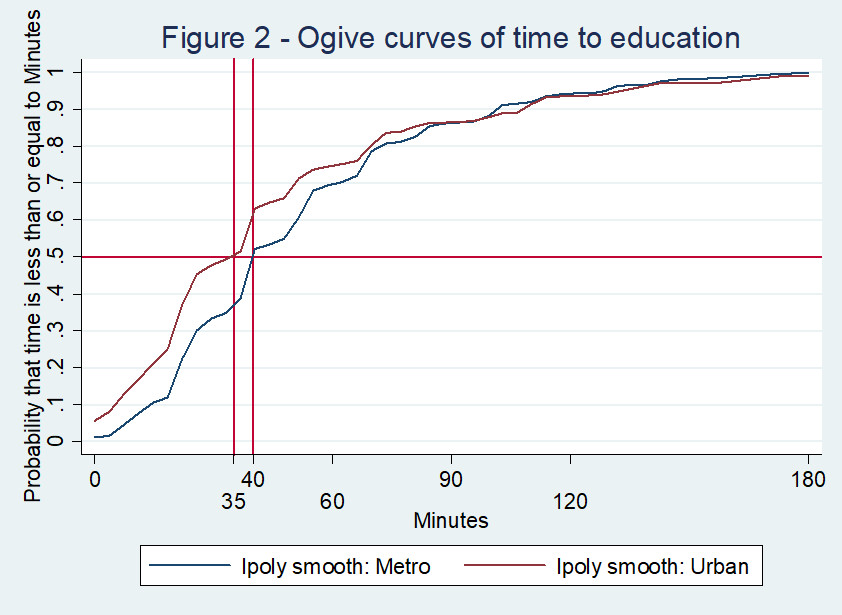
Figure 2 presents an ogive curve for time to educational institution. Here 50% of trips take 35 minutes or less in urban areas, and 40 minutes or less in metros.
How do average travel times to work in metros compare with those in cities around the world?
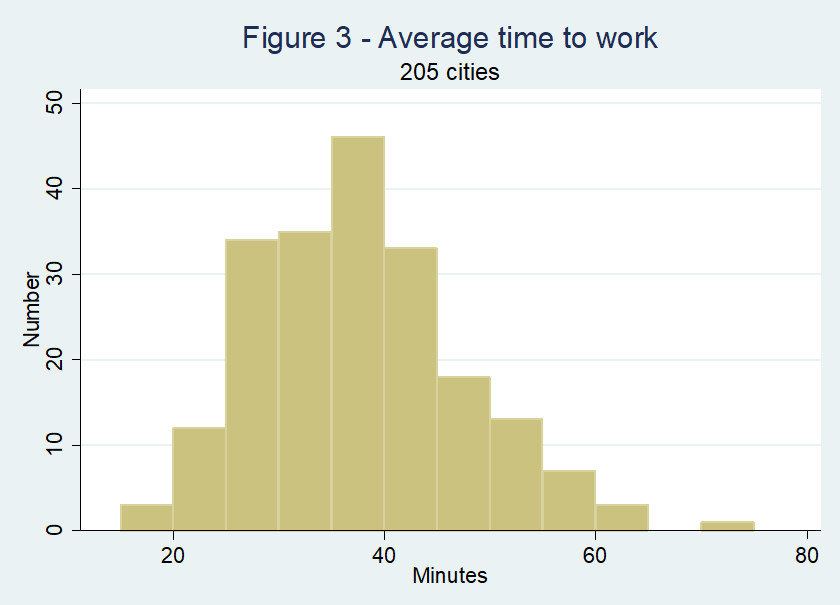
The Numbeo Traffic Index[3] contains information on the average time to work in 205 cities around the world. The median time to work in these cities is 37 minutes.
The average time to work and percentile position (from the shortest travel time) of four South African metros are set out in Table 8.
|
Table 8 - Time to work: four metros |
|
|
|
|
Average time (minutes) |
Percentile |
|
Ethekwini |
36 |
47 |
|
Cape Town |
42 |
72 |
|
Johannesburg |
46 |
83 |
|
Tshwane |
49 |
87 |
Conclusion
Comparison with General Household Survey data
The NHTS confirms the pattern found in the GHS that minibus taxis are used for more trips than buses and trains combined.
The average travel times recorded in the NHTS are considerably higher than those contained in the GHS. In light of the Numbeo data, the NHTS times are more accurate in recording the door to door travel times.
New information
Data extracted from the NHTS include the following:
Extent of travel
The purposes of travel
The modal split of all forms of travel
The reasons for walking all the way to destinations
The influence of household income on the modal split
The time spent travelling to work and to educational institutions
The distribution of time to work in 205 cities globally and the position of four metros in that distribution.
By Charles Simkins, Head of Research, HSF, 7 March 2018
[1] The NHTS has another: going home. This category is omitted here since it amounts to a return journey from a trip taken for another purpose.
[2] These days were selected randomly from Monday to Friday with equal probabilities.
[3] https://www.numbeo.com/traffic/rankings.jsp?title=2017
