
Local Government Revenue and Expenditure: Third Quarter Local Government Section 71 report for the period: 1 January 2022-31 March 2022
8 June 2022
National Treasury has released the local government revenue and expenditure report for the third quarter of the 2021/22 financial year. This report covers the performance against the adjusted budgets of local government for the third quarter of the municipal financial year ending on 31 March 2022 and includes spending against conditional grant allocations for the same period.
The report was prepared by using figures from the Municipal Standard Chart of Account (mSCOA) data strings. The mSCOA Regulations were promulgated on 22 April 2014 and prescribes the uniform recording and classification of municipal budget and financial information at a transaction level. All municipalities and municipal entities had to comply with the Regulations by 01 July 2017. The mSCOA Regulations require that municipalities upload their budget and financial information in a data string format to the Local Government portal across the six mSCOA regulated segments.
The report is part of the In-year Management, Monitoring and Reporting System for Local Government (IYM), which enables provincial and national government to exercise oversight over municipalities and identify possible challenges in implementing municipal budgets and conditional grants.
The credibility of the information contained in the mSCOA data strings is a concern but is improving as the reform is maturing. At the core of the problem is:
The incorrect use of the mSCOA and municipal accounting practices by municipalities;
A large number of municipalities are not budgeting, transacting and reporting directly in and from their core financial systems. Instead, they prepare their budgets and reports on an excel spreadsheet and then import the excel spreadsheets into the system. Often this manipulation of data lead to unauthorised, irregular, fruitful and wasteful (UIFW) expenditure and fraud and corruption as the controls that are built into the core financial systems are not triggered and transactions go through that should not; and
Municipalities are not locking their adjusted budgets or their financial systems at month-end to ensure prudent financial management. To enforce municipalities to lock their budgets and close their financial system at month-end in 2021/22, the Local Government Portal will be locked at the end of each month/quarter. System vendors were also requested to build this functionality into their municipal financial systems.
The actual COVID-19 expenditure reported by municipalities for the third quarter of the 2021/22 municipal financial year is included as a separate Annexure to this publication.
The Section 71 report facilitates transparency in reporting, better in-year management as well as the oversight of the financial performance of municipalities against their adjusted budgets. This report is, therefore, a management tool that serve as an early warning mechanism for councils, provincial legislatures, and municipal management to monitor and improve municipal performance timeously. The improvement of the credibility of the data strings is a priority for national and provincial treasuries and the submitted data strings are analysed monthly and errors are communicated to municipalities for correction.
KEY TRENDS:
Aggregate trends
1. On aggregate, municipalities spent 64.7 per cent, or R342 billion, of the total adjusted expenditure budget of R529 billion as at 31 March 2022 (third quarter results for the 2021/22 financial year). In respect of revenue, aggregate billing and other revenue amounted to 72.3 per cent, or R377.4 billion, of the total adjusted revenue budget of R521.9 billion.
2. Of the adjusted operating expenditure budget amounting to R461.7 billion, R306.7 billion or 66.4 per cent was spent by 31 March 2022.
3. Municipalities have adjusted the budget for salaries and wages expenditure at R137.4 billion (including remuneration of councillors), which is less by R556 million than the adopted budget of R138 billion reported in the second quarter of the 2021/22 municipal financial year. This constitutes 26 per cent of their total adjusted operational expenditure budget of R528.9 billion. As at 31 March 2022, spending on salaries and wages is 70.9 per cent, or R97.4 billion.
4. In the period under review, capital expenditure amounted to R35.4 billion, or 52.6 per cent, of the adjusted capital budget of R67.2 billion.
5. Aggregated year-to-date operating expenditure for metros amounts to R192.5 billion, or 70.5 per cent, of their adjusted operating budget expenditure of R273.1 billion. The aggregated adjusted capital budget for metros in the 2021/22 financial year is R30.2 billion, of which 40.8 per cent, or R12.3 billion, has been spent as at 31 March 2022.
6. When billed revenue is measured against their adjusted budgets for the core services, the performance of metros reflects a surplus for the third quarter of the 2021/22 financial year. This does not take into account the collection rate:
Water revenue billed was R25.6 billion against expenditure of R24.6 billion;
- Energy sources revenue billed was R68.8 billion against expenditure of R63.5 billion;
- The revenue billed for waste water management was R7.5 billion against expenditure of R5.6 billion, and
- Levies for waste management billed were R9.4 billion against expenditure R7.3 billion.
7. As at 31 March 2022, aggregated revenue for secondary cities is 77.7 per cent or R57.1 billion of their total adjusted revenue budget of R73.5 billion for the 2021/22 financial year. A year-on-year comparison shows that the total revenue on average has decreased by 6.6 per cent when compared to the same period in 2020/21.
8. The year-to-date aggregated operating expenditure level of the secondary cities is 67.7 per cent or R50.9 billion of the total adjusted operating budget of R75.2 billion for the 2021/22 financial year.
9. When billed revenue is measured against their adjusted budgets for the core services, the performance of secondary cities reflects a surplus for the third quarter of the 2021/22 financial year. This does not take into account the collection rate:
- Water revenue billed was R6.8 billion against expenditure of R5.9 billion;
- Energy sources revenue billed was R20.3 billion against expenditure of R16.5 billion;
- The revenue billed for waste water management was R2.8 billion against expenditure of R2 billion; and
- Levies for waste management billed were R2.5 billion against expenditure of R1.8 billion.
10. Capital spending levels are low at an average of 39.1 per cent or R3.1 billion of the adjusted capital budget of R7.9 billion.
11. Aggregate municipal consumer debts amounted to R255.2 billion (compared to R230.7 billion reported in the third quarter of 2020/21) as at 31 March 2022. Government debt accounts for 11.2 per cent, or R28.5 billion (R19.6 billion reported in the second quarter of 2021/22) of the total outstanding debtors. The largest component of this debt relates to households which account for 68 per cent or R173.6 billion (69.7 per cent or R182.4 billion in the second quarter of the current financial year).
12. Included in the outstanding debt is an amount of R217.8 billion, which is debt older than 90 days (historic debt that has accumulated over an extended period), interest on arrears and other recoveries which may not be realistically collectable by municipalities.
13. If consumer debt is limited to below 90 days, then the actual realistically collectable amount is estimated at R37.4 billion. This should not be interpreted that the National Treasury by implication suggests that the balance must be written-off by municipalities.
14. Metropolitan municipalities are owed R114.7 billion (R115.4 billion reported in the third quarter of 2020/21) in outstanding debt as of 31 March 2022. The largest contributors were the Cities of Johannesburg at 34.7 per cent, Ekurhuleni at 21.3 per cent and City of Tshwane did not provide information on their debtors for this quarter.
15. Households in metropolitan areas are reported to account for R79.5 billion or 69.3 per cent of outstanding debt, followed by businesses that account for R19.9 billion or 17.3 per cent. Debt owed by government agencies is at R14.6 billion or 12.8 per cent of the total outstanding debt owed to metros.
16. Secondary cities are owed R54.8 billion (R46.8 billion reported in the third quarter of 2020/21) in outstanding consumer debt. The majority of debt is owed by households, which amount to R36.9 billion, or 67.3 per cent, of the total outstanding debt. An analysis by customer group indicates an amount of R47.6 billion or 86.8 per cent, has been outstanding for more than 90 days.
17. Municipalities owed their creditors R81.1 billion as of 31 March 2022 and provinces with the highest percentage of outstanding municipal creditors in the category greater than 90 days include Free State at 91.1 per cent, Mpumalanga at 89.5 per cent, Northern Cape at 88.9 per cent and North West at 77.5 per cent. An increase in outstanding creditors could be an indication that municipalities are experiencing liquidity and cash challenges and consequently are delaying the settlement of outstanding debt owed.
18. The total balance on borrowing for all municipalities equates to R69.5 billion as of 31 March 2022. This includes long term loans of R50.3 billion, long term marketable bonds of R10.6 billion, and other long term non-marketable bonds of R5.5 billion. The balance represents other short- and long-term financing instruments and other short-term loans of R2.8 billion.
19. As of 31 March 2022, the total investments made by municipalities equates to R46.2 billion. This is R2.8 billion more than the R43.4 billion reported in the third quarter of the previous financial year (2020/21). Investments include Bank Deposits of R41.9 billion, guaranteed endowment policies (sinking funds) of R3.6 billion, Listed Corporate Bonds of R385.2 million and other smaller investments.
Conditional Grants
Conditional Grants Expenditure as at 31 March 2022
20. The third quarter publication in terms of section 71 of MFMA provides the performance of conditional grant funding and various adjustments to the baseline allocations approved during the financial year.
21. National Treasury published two national adjustment gazettes against the Division of Revenue allocations, namely Government Gazette No. 46014 and Government Gazette No. 46095 dated 7 March 2022 and 25 March 2022 respectively during 2021/22 financial year.
22. These gazettes were done in line with sections 18 and 19 of the 2021 Division of Revenue Act (DoRA) that stipulate that National Treasury may in its discretion or at the request of a Transferring Officer or receiving officer stop the transfer for schedule 4 and 5 allocations pertaining to anticipated underspending on programmes or allocations by the municipalities. In addition, the adjustment gazettes were done in terms section 15 of 2021 DoRA for considering amongst others, the rollovers, virements, shifts of allocations between schedules and the gazetting of all the funding allocated and transferred because of the disasters.
23. On 07 March 2022, National Treasury issued a Government Gazette No. 46014 following the enactment of the Division of Revenue Amendment Act, 2021 (Act No. 17 of 2021). This gazette published the stopping and reallocation of funds between municipalities, conversion, previous year’s rollovers, allocations of disaster funding between provinces and municipalities and correction of errors from previous gazettes in terms of sections 15, 18, 19, 20 and 25 of the 2021 DoRA.
24. Secondly, the adjustment gazette dated 25 March 2022 equally reflected adjustment of various grants in terms of sections 28 and 19 of DoRA. This gazette largely dealt with underperforming programmes.
25. The purpose of the chart below is analyse is to illustrate the relationship between the original allocation per municipality, their adjustment and how significant underspending
remains by the end of 31 March 2022.
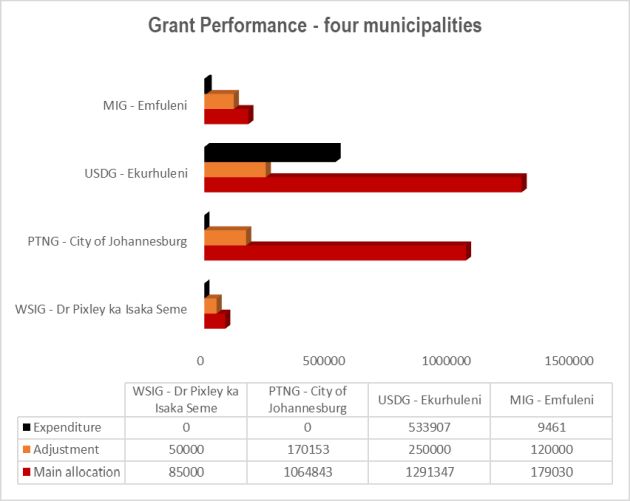
26. In terms of MFMA section 71 report the municipality does not show any signs of improvement against the adjusted allocation. Dr Pixley ka Isaka Seme reported zero expenditure against the adjusted allocation of R35 million for the period under review and the municipality has only the last quarter of the financial year to fully utilise the funds.
27. PTNG reduced the baseline allocations of City of Johannesburg Metropolitan Municipality with the amounts of R170.2 million against their allocations of R1.1 billion and the reason for the reduction is because of consistent underspending against the allocation.
28. In terms of MFMA section 71 report, City of Johannesburg reported zero expenditure against the adjusted allocation of R894.7 million.
29. Ekurhuleni Metropolitan Municipality had the highest amount of R250 million reduced from their USDG allocation of R1.3 billion. The stopping was informed by failure to spend 40 per cent of the allocation in the third quarter of the 2021/22 financial year.
30. The underperformance of MIG significantly affects service delivery because more than 90 per cent of MIG recipients’ municipalities benefit from the programme. The grant covers a large scope of municipalities especially those who are not able to raise their own revenue to fund capital projects and those that are grant dependent. During the adjustment process the MIG amount of R681.6 million was stopped from 42 municipalities and Emfuleni Local Municipality had the highest amount (R120 million) that was reduced.
31. The graph below provides an overview performance against the sample of grants that were affected by the stopping process. The WSIG, PTNG, USDG and MIG had their baseline reduced with the following amounts R 325.4 million, R1.6 billion, R300 million and R681.6 million against the original allocation of R3.6 billion, R6.5 billion, R7.4 billion and R15.6
billion.
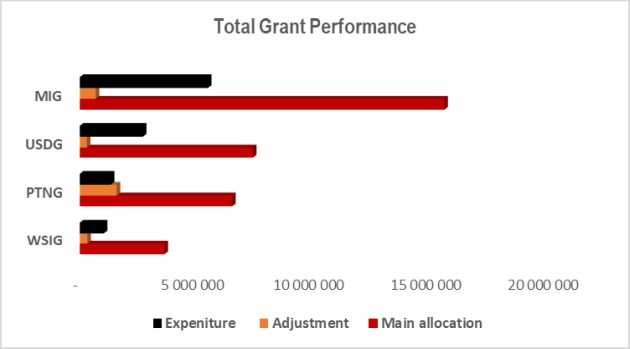
The expenditure reported by municipalities against these grants is not impressive because of significant underperformance. The WSIG, PTNG, USDG and MIG reported 28.4 per cent, 25.6 per cent, 36.4 per cent and 35.1 per cent respectively.
Total Conditional Grants Expenditure as at 31 March 2022
33. As at 31 March 2022, a total amount of R34.9 billion or 99.4 per cent has been transferred to municipalities against the adjusted direct conditional grant allocation of R35.1 billion. This amount excluded the Equitable Share allocation, USDG (supplementary capital allocation to metropolitan municipalities) and performance against roll-overs.
34. The Transferring Officers reported expenditure of 52 per cent against the total allocation for the period under review, while municipalities reported expenditure of 32.9 per cent against the R34.9 billion transferred to municipalities in the third quarter.
35. There are number factors that attributed to overall underspending of the conditional grants by municipalities in 2021/22 financial year. Some of these factors include the Covid-19 restrictions and the related delays on the procurement in the SCM processes, the November 2021 local government elections, the late submissions of business and implementation plans, amongst others. These factors also contributed to underperformance of conditional grants and resulted in the most municipalities having their allocations reduced during the adjustment process.
Capacity and Other Conditional Grants Expenditure as at 31 March 2022
36. At the end of the third quarter, a total adjustment amount of R2.4 billion was transferred for capacity grants and expenditure of 30.8 per cent was reported by municipalities. This expenditure includes the unallocated conditional grants such as the Municipal Disaster Grant (MDG) and the Municipal Emergency Housing Grant (MEHG), whose portions were allocated during the financial year as disasters were declared. The capacity grants are intended to assist municipalities in the development of their management, planning,
technical, budgeting, and financial management capabilities in the 2021/22 financial year, whilst the disaster grants are meant to assist municipalities in responding to a declared disaster and mitigating its impact.
37. The table below provides a summary of capacity grants at end of third quarter which ended at 31 March 2022. However, the table does not reflect the balance of the unallocated disaster funds since the MFMA section 71 reports focuses on performance against allocated funds.
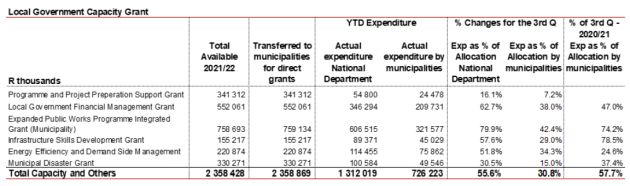
The capacity grants reflect a significant decline of 57.7 per cent achieved in the same period in the last financial year. The municipalities reported expenditure of far less than 50 per cent for the period under review, while departments indicated 55.6 per cent expenditure. The low expenditure reported may be because of most projects being in the procurement stage, late appointment of service providers and delays caused by Covid-19 restrictions.
39. The lowest performing grant in the third quarter ended 31 March 2022 is the newly introduced grant, namely the Programme and Project Preparation Support Grant (PPPSG) with a reported expenditure performance of 7.2 per cent against their allocation. A concerted effort is required from the Transferring Officer to support municipalities that receive this grant to improve performance against this programme.
Infrastructure Conditional Grants Expenditure as at 31 March 2022
40. Direct conditional grants allocated for 2021/22 financial year against the infrastructure grants were adjusted to an amount of R35.1 billion following the reduction of R472.2 million during the adjustment process from the original allocation of R35.6 billion and excludes the USDG.
41. From the amount of R35.1 billion allocated, R34.9 billion or 99.4 per cent has been transferred to municipalities and 32.9 per cent or R11.5 billion was reported as expenditure as at 31 March 2022 against the revised total infrastructure allocation. Again, the USDG’s performance is excluded from the assessment based on the same reason mentioned above.
42. The chart below, reflects third quarter performance against infrastructure allocations. Municipalities are still struggling to accelerate their performance on projects and reported performance lower than 50 per cent at the end of the third quarter. This is despite the concerted efforts that are implemented by both national and provincial departments to improve the grant performance. Similar challenges that affected capacity grants are also evident on infrastructure grants performance.
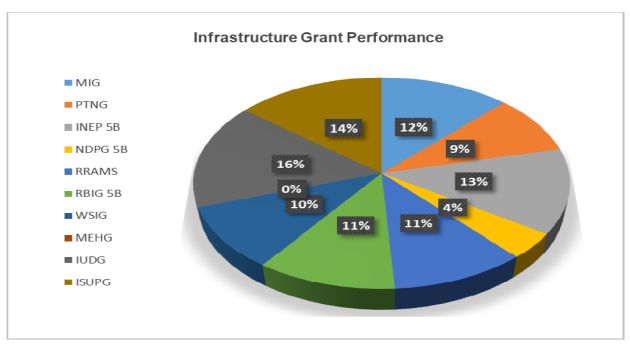
The chart shows how the capital grants have performed at end of the third quarter, ended 31 March 2022. The chart also depicts the percentage contribution of each infrastructure grant towards the R11.5 billion or 32.9 per cent expenditure. The MIG contributes to 12 per cent of the total expenditure incurred.
44. The metropolitan municipalities have reported the expenditure of 36.4 per cent or R2.3 billion against the USDG allocation of R7.4 billion.
A summary of key aggregated information is included in the tables in Annexure A.
Further details on this report can be accessed on the National Treasury’s website: www.treasury.gov.za.
Issued by National Treasury, 8 June 2022
