
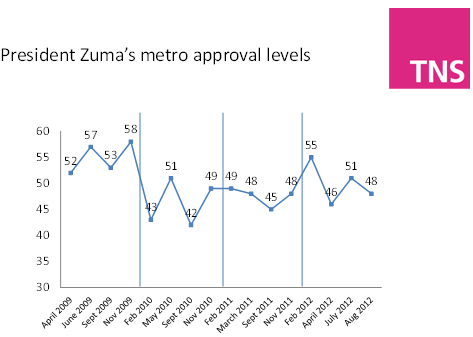
Whilst President Zuma's metro approval levels stabilize at 48%, other players are higher
More people in metro areas feel that Mr Motlanthe rather than Mr Zuma should be our next President
Johannesburg, 20 September 2012: The President's approval rating in metro areas in the first two weeks of August 2012 stood at 48%. This compares with 55% in February, 46% in mid-April and 51% in a smaller survey in July. This is according to results released today by TNS, South Africa's leading marketing and social insights company, which has been tracking approval levels of the incumbent President for many years. The studies are conducted amongst a sample of 2 000 SA adults from the seven major metropolitan areas of South Africa, interviewing them face-to-face in their homes, with a margin of error of under 2.5%. The July study was a smaller cell-phone study of 200 people in metro areas - it has a margin of error of ±7%.
|
% |
Apr-09 |
Jun-09 |
Sep-09 |
Nov-09 |
Feb-10 |
May-10 |
Sep-10 |
Nov-10 |
|
Approve |
52 |
57 |
53 |
58 |
43 |
51 |
42 |
49 |
|
Disapprove |
29 |
13 |
19 |
23 |
41 |
33 |
44 |
34 |
|
Don't know |
19 |
31 |
28 |
19 |
17 |
16 |
15 |
17 |
|
Net positives* |
23 |
44 |
34 |
35 |
2 |
18 |
-2 |
15 |
****
|
% |
Feb-11 |
Mar-11 |
Sep-11 |
Oct/Nov 2011 |
Feb-12 |
Apr-12 |
Aug-12 |
|
Approve |
49 |
48 |
45 |
48 |
55 |
46 |
48 |
|
Disapprove |
35 |
38 |
41 |
38 |
35 |
46 |
44 |
|
Don't know |
16 |
14 |
14 |
14 |
10 |
8 |
8 |
|
Net positives* |
14 |
10 |
4 |
10 |
20 |
0 |
4 |
* Net positives are given by subtracting those who feel he is NOT doing a good job from those who feel he IS doing a good job.
As usual, approval levels differ considerably by population group, with blacks having an approval level of 62%, whites having an approval level of 24%, coloureds 19% and Indians/Asians 23% - these are all similar to figures achieved in April. There is no difference by gender. Younger people are more positive but this largely correlates with the age profiles of the different race groups. People whose home language is isiZulu have the highest ratings at 71%, English and Afrikaans speakers average 24% and other language groups average 55%.
The July study also incorporated a small non-metro component (100 adults) who evinced an approval level of 71% (this has a margin of error of ±9%).
Deputy President Kgalema Motlanthe
By contrast, the approval rating of the Deputy President in August was 51%, with 34% being negative and 16% giving a "don't know" responses. This compares with 49% in April. Hence, the small lead for the Deputy President over the President has been maintained from April to August.
Whilst the figures for whites, coloureds and Indians/Asians in August average 23%, 65% of blacks approve of the way the Deputy President is doing his job. The age variation seen for the President is not evident here, with the higher approval levels coming from those aged 25 to 34 years (58%) and the lowest from those aged 50 to 50 years (39%). No gender differences are evident. All black language groups evince essentially the same approval level of 65%. This is the same as in April. The figures for other race groups show a rise amongst whites and Indians/Asians.
Who should be the next President?
The study also looked at whether President Zuma should have a second term as President, as well as whether Kgalema Motlanthe should be the next President.
In metro areas, 32% feel that President Zuma should have a second term (55% disagree and 13% gave a don't know response) whilst 39% feel that Mr Motlanthe should be our next President (40% disagree and 27% gave a don't know response). Whilst age and gender differences are small, breaking this down by population group shows that Mr Motlanthe's lead comes largely from the black metro population:
|
|
Total metro |
Blacks |
Whites |
Coloureds |
Indians/Asians |
|
President Zuma should have a second term |
32 |
41 |
17 |
12 |
18 |
|
Kgalema Motlanthe should be the next president |
39 |
51 |
18 |
16 |
9 |
Differences by area
There are usually strong regional differences in such figures. These are outlined below and show that the main change for the President in his approval rating has been in Soweto where the figure of 48% is the lowest since the President assumed office; the Port Elizabeth figure of 30% is also an all-time low. However, he has regained some traction in Durban.
The Deputy President shows gains in the West Rand and Pretoria, as well as in Durban and Port Elizabeth.
The Deputy President shows higher approval ratings than the President in Gauteng (especially Soweto and Pretoria) and the Eastern Cape but is lower in Durban.
|
|
Pres Zuma - 2012 |
Dep Pres Motlanthe - 2012 |
||||||
|
|
|
|
Feb |
Apr |
Aug |
Apr |
Aug |
|
|
Gauteng |
|
60 |
52 |
54 |
59 |
60 |
||
|
|
Johannesburg & environs |
|
61 |
55 |
55 |
59 |
59 |
|
|
|
Johannesburg excl Soweto |
56 |
51 |
55 |
54 |
55 |
||
|
|
East Rand |
64 |
65 |
61 |
62 |
59 |
||
|
|
West Rand |
52 |
|
59 |
54 |
62 |
||
|
|
Soweto |
73 |
50 |
48 |
68 |
63 |
||
|
|
Vaal Triangle/ South Rand |
58 |
49 |
50 |
56 |
59 |
||
|
|
Pretoria |
|
56 |
39 |
49 |
58 |
65 |
|
|
Cape Town |
|
|
34 |
30 |
24 |
27 |
26 |
|
|
Durban |
|
|
61 |
50 |
58 |
43 |
47 |
|
|
Eastern Cape |
|
57 |
37 |
35 |
39 |
48 |
||
|
|
Port Elizabeth |
|
38 |
33 |
30 |
28 |
44 |
|
|
|
East London |
|
85 |
45 |
45 |
64 |
56 |
|
|
Bloemfontein |
|
|
78 |
52 |
47 |
52 |
56 |
|
***
|
|
President Zuma should have a second term |
Kgalema Motlanthe should be the next President |
||
|
|
|
|
Aug |
Aug |
|
Gauteng |
|
38 |
49 |
|
|
|
Johannesburg & environs |
|
41 |
49 |
|
|
Johannesburg excl Soweto |
44 |
35 |
|
|
|
East Rand |
45 |
52 |
|
|
|
West Rand |
54 |
60 |
|
|
|
Soweto |
30 |
54 |
|
|
|
Vaal Triangle/ South Rand |
29 |
57 |
|
|
|
Pretoria |
|
28 |
48 |
|
Cape Town |
|
|
14 |
16 |
|
Durban |
|
|
44 |
28 |
|
Eastern Cape |
|
8 |
39 |
|
|
|
Port Elizabeth |
|
6 |
36 |
|
|
East London |
|
13 |
47 |
|
Bloemfontein |
|
|
40 |
40 |
In terms of presidential choice, the Mr Motlanthe is ahead of Mr Zuma in many parts of Gauteng, especially Soweto, the South Rand/Vaal Triangle and Pretoria, and the Eastern Cape but Mr Zuma is ahead in Durban. Linked to this, Mr Zuma is just ahead amongst isiZulu home speakers (52% cf 48%) but well behind amongst all other black language groups:
- isiXhosa: Mr Zuma - 22%; Mr Motlanthe - 46%
- SeSotho: Mr Zuma - 40%; Mr Motlanthe - 59%
- Setswana/other: Mr Zuma - 40%; Mr Motlanthe - 54%
Helen Zille
The study also asked whether people felt that Helen Zille was doing a good job as Premier of the Western Cape. Overall 47% of metro dwellers agreed that she was (blacks - 35%, whites - 74%, coloureds - 71%, Indians/Asians - 49%).
In Cape Town, 68% of metro dwellers agreed she was doing a good job (blacks - 41%, whites - 89%, coloureds - 76%).
Our take out
Whilst Mr Zuma's and Mr Motlanthe's approval levels are very similar, the Deputy President has maintained a small lead for the last six months. This small lead occurs across all race groups.
However, in terms of presidential choice, the gap between the two men is somewhat wider, with strong regional and language differences, not surprisingly, being evident. Amongst black metro dwellers, Mr Motlanthe has (just) a majority of support - and, especially, in Soweto. However, in all questions, the percentage of people giving a don't know response is higher for Mr Motlanthe - a feature seen in all surveys conducted by TNS in recent years. This does mean that people are less sure about him.
Technical note:
All the studies except the July cell-phone study were conducted amongst 2 000 adults (1260 to 1290 blacks, 350 to 385 whites, 240 coloureds and 115 Indians/Asians) in the seven major metropolitan areas: it has a margin of error of under 2.5% for the results found for the total sample. The studies use probability sampling techniques and are fully representative of the major metropolitan areas. The studies were conducted by TNS South Africa as part of their ongoing research into current social and political issues and were funded by TNS. For more details, please contact Neil Higgs on 011-778-7500 or 082-376-6312. www.tnsglobal.co.za
About TNS
TNS advises clients on specific growth strategies around new market entry, innovation, brand switching and stakeholder management, based on long-established expertise and market-leading solutions. With a presence in over 80 countries, TNS has more conversations with the world's consumers than anyone else and understands individual human behaviours and attitudes across every cultural, economic and political region of the world. TNS is part of Kantar, one of the world's largest insight, information and consultancy groups.
Statement issued by Neil Higgs, Senior Advisor and Head of innovation, TNS South Africa, September 25 2012
Click here to sign up to receive our free daily headline email newsletter
