
QUARTERLY LABOUR FORCE SURVEY: Quarter 1 (January to March), 2015
The 2013 (new) master sample
26 May 2015
Redesigning of a master sample is a process routinely undertaken by Statistical Agencies following a population Census. Stats SA redesigned the 2007 (old) master sample in 2013 using the 2011 census data. The 2011 census showed that the structure of the underlying population had changed compared to the previous Census. The new master sample should improve the level of precision in the estimates produced.
The old master sample was designed in 2007 using the 2001 Census data; this was the latest information available at the time. The sample was implemented in January 2008 to conduct the Quarterly Labour Force Survey (QLFS) and all other household surveys. The QLFS estimates for 2008 to 2014 (Q1: 2008 to Q4: 2014) resulted from the 2007 master sample.
The Q1: 2015 (Jan-to-Mar 2015) estimates presented in this report are based on the new master sample (designed in 2013), while the previous quarters are based on the old master sample. The quarter-to-quarter and year-on-year changes are influenced by the change in the updated sample. Stats SA will monitor estimates produced by the new master sample over the next quarters until they have stabilised.
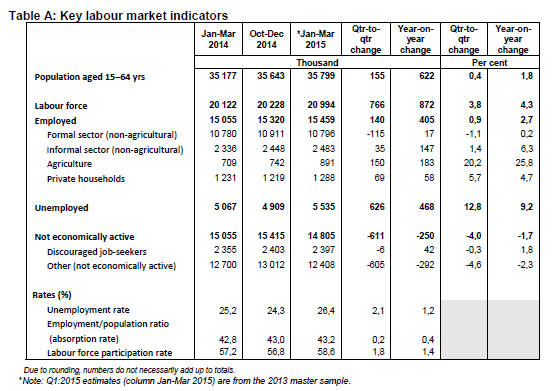
The results for Q1: 2015 shows that the working age population (WAP) was 35,8 million – 15,5 million employed, 5,5 million unemployed and 14,8 million not economically active. Thus resulting in an unemployment rate of 26,4%, absorption rate of 43,2% and labour force participation rate of 58,6%. The formal sector accounted for the largest share of employment at 69,8% while the agriculture accounted for the lowest share (5,8%). Around 16% of the not economically active population was accounted for by the discouraged, while more than 80% were due to other reasons (i.e. student, home-maker etc.). The results for Q1: 2015 reflect a decrease in the not economically active population in favour of the economically active population
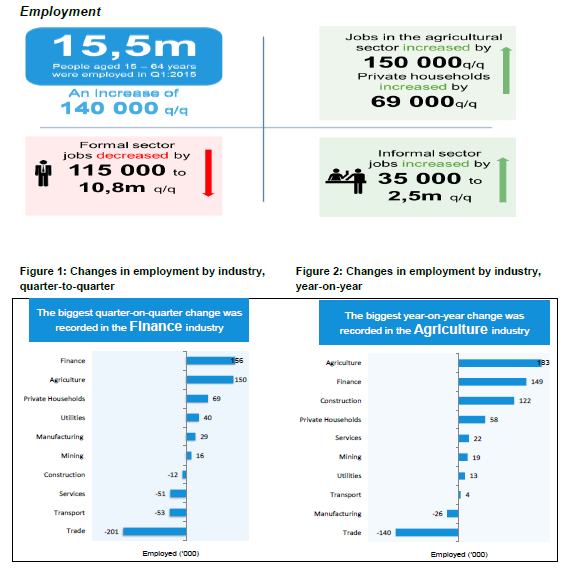
The number of employed people increased by 140 000 in Q1: 2015 compared to Q4: 2014. Large quarterly gains were observed in the Finance (156 000), Agriculture (150 000) and Private households industries (69 000). Job losses were recorded in the Trade, Transport and Community and social services industries (201 000, 53 000 and 51 000 respectively).
Compared to the same period last year, employment increased by 405 000. Large annual increases were observed in the Agriculture (183 000), Finance (149 000) and Construction (122 000). The largest decreases in employment were observed in the Trade industry (140 000).
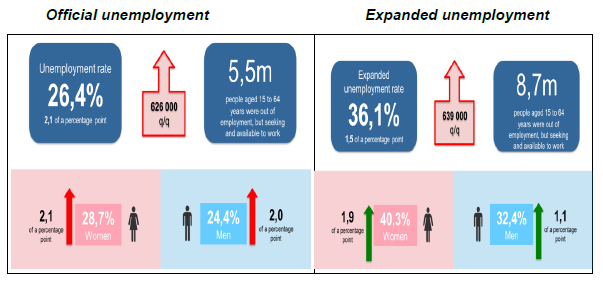
Q1:2015, the number of unemployed people was 5,5 million. The expanded unemployment rate, which relaxes the requirement for job searchers to be classified as unemployed, increased by 1,5 percentage points to 36,1% in Q1: 2015.
Not economically population (NEA) by reason for inactivity in 2015
The analysis this quarter focuses on the inactive population over the period Q1: 2008 to Q1: 2015. The NEA population is that part of the population which is out of the labour force, however changes in the NEA population has considerable effect in the labour force. According to the resolution adopted in the 19th international conference of labour statisticians1, people who are not seeking employment but available to work are classified as the potential labour force of a country.
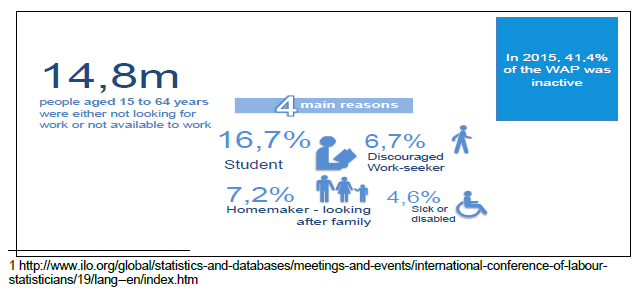
Students, home-makers and discouraged job-seekers make up the top three reasons for economic inactivity. Around 40% of the working age population is not economically active, with students accounting for the largest share 16,7% in Q1:2015.
Conclusion
After a Census, statistical agencies update the sample which is used by household surveys to collect information on the activities of the working age population (15-64 years). This is to account for changes in the composition of the population which occur between Censuses. In addition certain improvement may be incorporated in the design. In the case of South Africa this relates to improvements in the Mining estimates of employment and publishing estimates of the labour market at the metro level. In addition, the size of the sample was increased which should improve the precision of the estimates produced.
While overall the number of employed increased, employment levels in the formal sector declined by 115 000 on a quarterly basis in line with seasonal trends since 2008 in which employment levels declined in the first quarter of 2015 following an increase in fourth quarter of 2014 ahead of the festive period.
The new master sample improves the precision of the estimates of labour market indicators produced by the QLFS as it takes into account the changes in the structure of the population and labour market which occurred between the 2001 and 2011 Census.
The process of updating the Master Sample is a regular occurrence which follows from a population Census as new information becomes available based on the households which were enumerated during the Census. The new Master Sample through its improved design aims to build on the quality of labour market data produced by Stats SA.
Statement issued by Ms Kefiloe Masiteng, Deputy Director-General: Population and Social Statistics, May 26 2015
