
Briefing note for journalists: Inconsistencies in the data from the Post-Enumeration Survey (PES) report
We have identified a number of what appear to be inconsistencies in the report on the Post-Enumeration Survey (PES) released by Statistics South Africa (Stats SA) on 7 November. Based on the arguments set out below, we sought to get Stats SA to either rectify the numbers or to explain to us where our reasoning was wrong, to avoid further public debate, but to no avail. We discuss these inconsistencies below, setting out the nature of our concerns, their implications, as well as why we believe that their resolution is important to one's ability to interpret and understand the 2011 census.
The uncertainty surrounding the number of people in the population from the 2011 census after adjustment using the PES
It is commonly believed that the census is a count of the number of people in the country - it is not. It is, at least in South Africa, an estimate of the size of the population. Following the census, Stats SA carries out a (relatively) small survey, the Post Enumeration Survey (PES), of 600 enumeration areas (from a total of over 100,000 in 2011), to evaluate how well the census counted the people and recorded basic information such as age, sex and population group.
The extent to which the population was undercounted is estimated from the results of this survey using established statistical techniques. The final population estimates are then adjusted by these estimates of the undercount. Thus, according to Stats SA, the population actually counted, 44.3 million (42.51 million in-scope, plus 1.79 million out-of-scope according to the PES report), represented only 85.3% of the estimated total population of 51.8 million.
However, because this estimate is derived from a small sample there is some statistical uncertainty about the estimate of the extent of the undercount, and hence about the actual number of people in the country on census night. Thus, according to Table 14 of the published report on the PES we can be reasonably sure (i.e. there is a 95% probability) that the true number of people at the time of the census was somewhere between 49.8 and 53.7 million people.
This uncertainty extends to the estimates of any subgroup of the population. Details of the uncertainty in the estimate of the undercount and of the uncertainty in the estimate of population numbers are only published for the provinces (although the uncertainty ranges of the estimates of the undercount alone are published for urban/rural, population groups, age groups and sex).
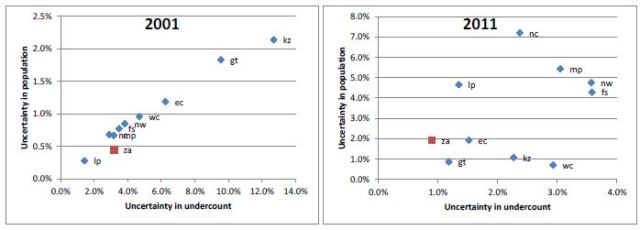
Now, logically, one would expect that the provinces for which the relative uncertainty around the estimate of the undercount was greatest would also be those where the relative uncertainty around the estimate of the number of persons was the greatest (since the uncertainty arises only from the uncertainty in the estimate of the undercount). And indeed, as can be seen from the left hand graph in the figure below, this was the case with the 2001 census, where the correlation between the two measures of uncertainty for the provinces is 99%.
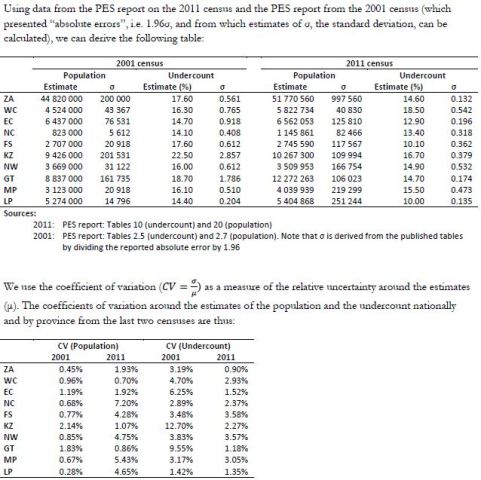
However, in 2011 (shown on the right hand side) there is no such relationship (the correlation is barely 33%), which suggests that the published data cannot be correct. (Here relative uncertainty is measured by what is known as the ‘coefficient of variation', i.e. the standard deviation divided by the mean. The derivation of these measures is set out in the Annexure.)
Further, an inspection of the scales of the axes also suggests there are problems with the published estimates of uncertainty. In 2001 the relative uncertainty around the population estimates at a provincial level were all less than 2.5% while that around the estimates of undercount were around 5 times bigger. (This is to be expected since the relative uncertainty around the estimate of undercount is measured relative to the undercount, while that around the estimate of the population is effectively measured relative to the count of the population. If the undercount in 2001 was 1 in 6 then the count (i.e. 5 in 6) is five times the size of the undercount.)
However, in 2011 not only are the scales of the axes very different from those in 2001 but there is now apparently more uncertainty relative to the count of the population than there is relative to the undercount of the population. This does not make sense: relative to 2001, the uncertainty around the size of the undercount in 2011 is some 3 times smaller than it was in 2001, yet the uncertainty around the size of the population is more than 4 times greater. Given that the size of the PES in both censuses is roughly similar (although the sampling fraction in 2001 would have been slightly larger given the smaller total number of enumeration areas in the earlier census), we would have expected roughly equivalent orders of magnitude of the uncertainty.
These anomalies are particularly stark when considering the Western Cape, Gauteng and KwaZulu-Natal. These provinces have the lowest relative uncertainty in the estimate of the population and yet a wide range of relative uncertainty about the undercount. And in the case of some of the other provinces the uncertainty is very high. For example, in the case of the Northern Cape this uncertainty extends to plus or minus 14% around the estimated population. Such a wide range of uncertainty in the population nationally and provincially should raise concerns about the reliability of these numbers to be used in determining, for example, the Equitable Share.
Another result of this is that whereas the 95% confidence interval around the estimate of the population in 2001, with a greater undercount than 2011, was plus or minus 392,000, in 2011 the uncertainty is apparently plus or minus 2 million!
Data released on households
We also raised several concerns about the data on households in the census. These include:
- First, we investigated the uncertainty around the number of households and the uncertainty around the undercount of households, similar to the investigation described above for individuals. While the estimates of uncertainty for the households are less obviously problematic in terms of the correlation between the relative uncertainty in the estimate of undercount and that of the estimate of the number of households, there is still a problem of scale, the relative uncertainty around the estimate of the undercount of households in 2011 being less than 1/7th of that in 2001.
- Second, we have not been able to reconcile the number of households represented in the tabulations of the Census in Brief and Statistical Releases with that reported in the PES report. The two former documents give the total number of households, defined as being "in housing units and converted hostels", in the country as being 14.45 million. The PES report, however, reflects the number of households "in housing units only. It includes the housing units in the in-scope EAs and the out-of-scope EAs; however, it excludes hostels and other collective living quarters" page 60), as being 15.07 million. The equivalent data from the 2001 census evinces no such inconsistencies, despite the description of the derivations of the number of households being identical in the two PES reports. Our concern here is that we cannot be certain which, if either, of the reported number of households, nationally, and in each province, is correct. This has implications for measuring service delivery achievements and shortfalls.
Miscellaneous
- The statement on page 49 of the report, introducing Table 13, is incorrect. The estimates of the undercount by age, especially for Africans, are almost all statistically different from each other.
Response from the Statistics South Africa
The initial response from the Statistician General (SG) to our queries was to ask for six days "to personally deal with the questions and give them my undivided attention", but he nevertheless assured us that he remained "confident that the figures would remain as they are".
When, after 8 days, we had had no response we emailed the SG again and were told, with little evidence of any further investigation or serious effort to engage with the logic of our principal arguments, that there was "absolutely nothing wrong with the adjustment factors" and that "there are no errors in the data".
Conclusions
Since the release of the results of the census began on 30 October, our major concern has been that there are unexpected results and inconsistencies in the data that suggest that the release of the results, as well as the initial analysis, were unduly rushed, not allowing careful scrutiny prior to release. The issues outlined here speak again to this concern.
Finally, the issues we have already raised in the media (for example, about the rather odd age distribution of the population under the age of 19; the implications of this for the national trend in fertility over the last 15 years; as well as the consistency of the estimates of the provincial populations) remain.
Annexure: Relative uncertainty around the national and provincial estimates of population and undercount
Tom Moultrie is Associate Professor of Demography and Director of the Centre for Actuarial Research (CARe) at the University of Cape Town
Rob Dorrington is Professor of Actuarial Science in the Centre for Actuarial Research (CARe) at the University of Cape Town
Click here to sign up to receive our free daily headline email newsletter
