1. Confirmed cases of local transmission remain on an upward trajectory
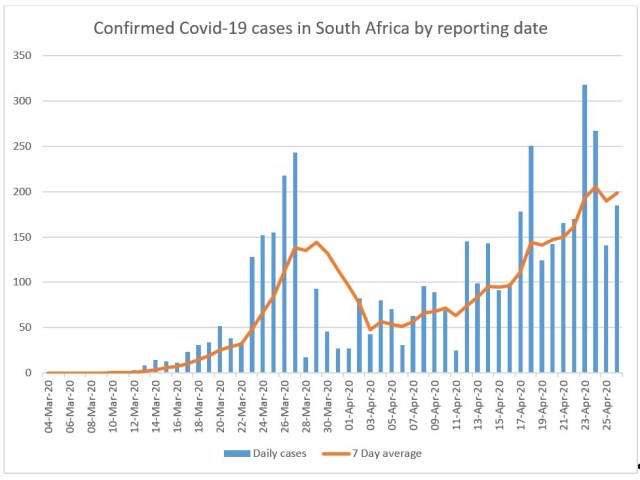
On Tuesday evening, 28th April 2020, Zweli Mkhize released the latest statistics for the Covid-19 epidemic in South Africa. 7 027 tests had been processed, and 203 positive cases reported, a hit rate of 2,9%. This brought the total number of cases reported – many of whom would now have recovered – to 4 996, with 93 fatalities. This means that despite the lockdown the number of confirmed cases of local transmission remain on an upward trend.
Almost all of the initial cases reported in early to late March were of people who had become infected overseas, and their close contacts. This led to a spike towards the end of the month as a huge number of tests, mostly conducted by private sector laboratories, were processed. Given the lag time between infection and the processing of test results, the cessation of most international travel in mid-March then resulted in to a massive drop off of reported cases at the end of the month, just as the lockdown began. Since then there has been a steady, though not exponential, increase in confirmed cases, almost all driven by local transmission.
2. Australia and New Zealand - though not Chile, Argentina and Uruguay - are doing far better than SA in suppressing the epidemic
It is likely that Covid-19, like other respiratory diseases, will display a marked seasonality in the world’s temperate regions. Further to the other reasons for this mentioned previously, it seems that the SARS-CoV2 virus may be highly vulnerable to direct sunlight. Vitamin-D deficiency may also make those infected more vulnerable to the Covid-19 disease.
As noted previously South Africa’s current situation is best assessed against that of other countries located (predominantly) below the Tropic of Capricorn, and for which data is available. The country’s highly onerous lockdown rules have not been able, as of yet, to put the genie back in the bottle. This is in contrast with the record of Australia and New Zealand. Both of these first world countries also had “imported” epidemics, similar to South Africa’s, but have – following the curtailment of international travel and the implementation of stay at home orders - now successfully brought the number of new daily cases of local transmission to a minimal number.
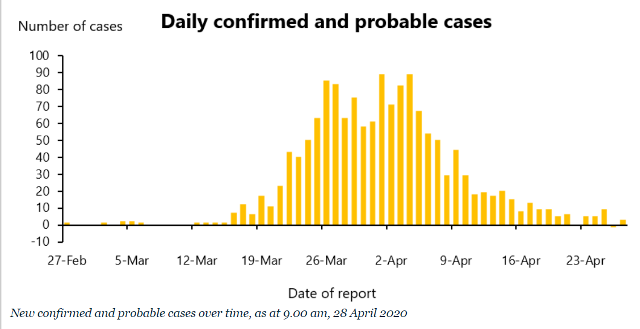
Australia reported that as of 3:00pm on 28 April 2020, there had been a total of 6,731 confirmed cases, 5,626 recoveries, and 84 deaths - with only 11 new cases reported over the past 24 hours.
Confirmed daily cases of Covid-19 in Australia by date:

New Zealand meanwhile has reported a total of 1 472 confirmed and probable cases, 1 214 recoveries, and 19 deaths – with 3 cases confirmed over the past 24 hours.
Confirmed daily cases of Covid-19 in New Zealand by date:
Both countries are now talking of eliminating the virus completely, which would require keeping it out through tight restrictions on arrivals from the rest of the world.
In South America meanwhile Chile, Argentina and Uruguay have been less successful in bringing down the number of daily cases, though they are not increasing exponentially.
The current situation in all these countries is summarised in the following table:
Table 1: Current Covid-19 situation* in certain countries below the Tropic of Capricorn:
|
|
Population (million) |
Total cases |
Total deaths |
Confirmed cases reported over previous 24 hours* |
|
Argentina |
44,49 |
4 003 |
197 |
111 |
|
Australia |
24,99 |
6 731 |
84 |
11 |
|
Chile |
18,73 |
13 813 |
198 |
482 |
|
New Zealand |
4,89 |
1 472 |
19 |
3 |
|
South Africa |
57,78 |
4 996 |
93 |
203 |
|
Uruguay |
3,45 |
620 |
15 |
14 |
|
Total |
154,33 |
31 635 |
606 |
824 |
* Figures as reported on the 28th April 2020
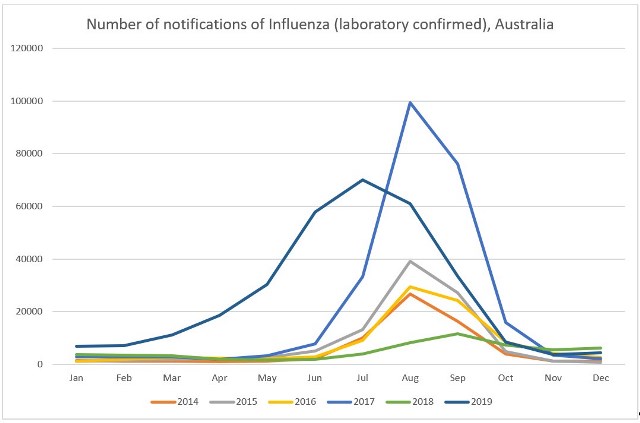
The challenge will be to suppress the epidemic as the southern hemisphere moves into winter and its annual ‘flu season’. This will make it harder to screen for Covid-19, will increase the burden on hospitals, and also (very probably) increase the rate of transmission of the SARS-CoV-2 virus. This means that measures that were sufficient to limit the spread of the virus in late summer, will become increasingly inadequate in autumn going into winter. In Australia at least flu season generally begins its ascent in May, takes off in June, and peaks in either August or September, before falling away in October.
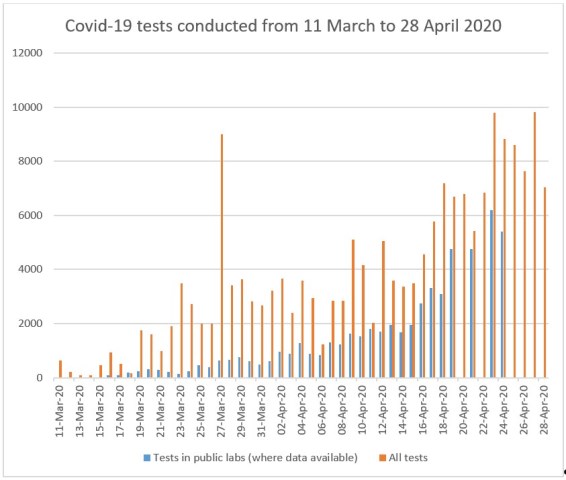
3. After a very slow start testing in the public sector now appears to be running at over 5 000 tests per day
One of the main failures of government during the initial stages of the epidemic was overly restrictive requirements for testing to be done in the public sector. In the eleven days before the lockdown public laboratories averaged 236 tests per day. In the first week of the lockdown an average of 667 tests were done per day. At this point, on the 2nd April, testing requirements were relaxed. In the second week an average of 1143 tests per day were performed, in the third week, an average of 1 143, and in the third week an average of 1 906 per day. Currently it seems that over 5 000 tests or so are being performed in public laboratories per day. This has pushed up the total number of tests being performed in both private and public laboratories to an average of 8300 over the past seven days.
In terms of the current criteria a person can be tested within the public health system – even if they are not a contact of someone with Covid-19 – if they have “acute respiratory illness with sudden onset of at least one of the following: cough, sore throat, shortness of breath or fever [≥ 38°C (measured) or history of fever (subjective)] irrespective of admission status.”
This may be too restrictive, especially if the number of tests being done is significantly below capacity.
The updated US CDC advice states that “People with COVID-19 have had a wide range of symptoms reported – ranging from mild symptoms to severe illness. Symptoms may appear 2-14 days after exposure to the virus. People with these symptoms or combinations of symptoms may have COVID-19: Cough, Shortness of breath or difficulty breathing; Or at least two of these symptoms: Fever, Chills, Repeated shaking with chills, Muscle pain, Headache, Sore throat, New loss of taste or smell”.
4. The epidemic appears to be taking off in the Western Cape
If one views the provincial breakdown of new cases, there is a huge discrepancy provincially. A majority of daily cases are being reported from the Western Cape, and this is driving the increase in total cases nationally. Cases are being confirmed across the Eastern Cape, including in areas throughout the Transkei. KwaZulu and Gauteng are, meanwhile, not reporting any great increase in the number of cases. Health authorities in the Free State, Limpopo, North West and Mpumalanga have barely reported any new cases at all since mid-April, to add to their relatively low total numbers.
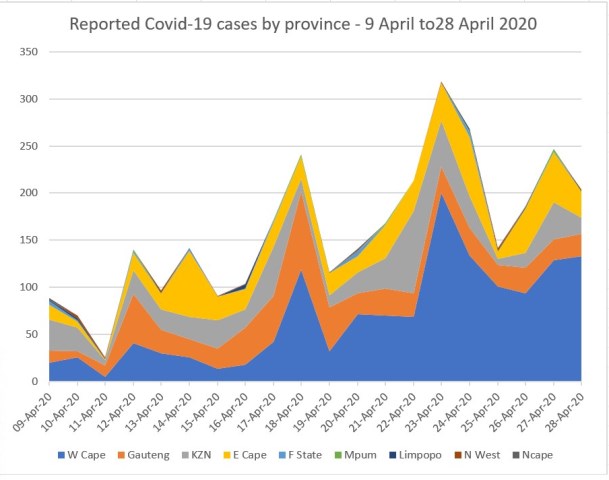
It appears that the epidemic is on an upward trajectory in the Western Cape. This reflected not just in the increase in those testing positive, but in the high hit rate for those being tested, as well as in the increase in hospitalisations.
Table 2: The situation in the Western Cape over past nine days
|
|
Daily tests conducted |
New cases |
Hit rate |
Patients in hospital |
Patients in ICU |
Total deaths |
|
20-Apr-20 |
808 |
39 |
4,8% |
37 |
17 |
17 |
|
21-Apr-20 |
1 624 |
69 |
4,2% |
39 |
17 |
17 |
|
22-Apr-20 |
1 337 |
94 |
7,0% |
43 |
19 |
22 |
|
23-Apr-20 |
809 |
85 |
10,5% |
53 |
23 |
25 |
|
24-Apr-20 |
1 614 |
161 |
10,0% |
62 |
24 |
28 |
|
25-Apr-20 |
1 550 |
121 |
7,8% |
63 |
16 |
30 |
|
26-Apr-20 |
1 533 |
96 |
6,3% |
68 |
26 |
32 |
|
27-Apr-20 |
892 |
87 |
9,8% |
75 |
26 |
33 |
|
28-Apr-20 |
2 038 |
160 |
7,9% |
83 |
28 |
35 |
The question is to what degree this reflects a different situation on the ground in the Western Cape or just more and better targeted testing.
It is plausible that the province had more people coming in with the disease from Europe in early March, and these may have set off a number of different trains of infection.
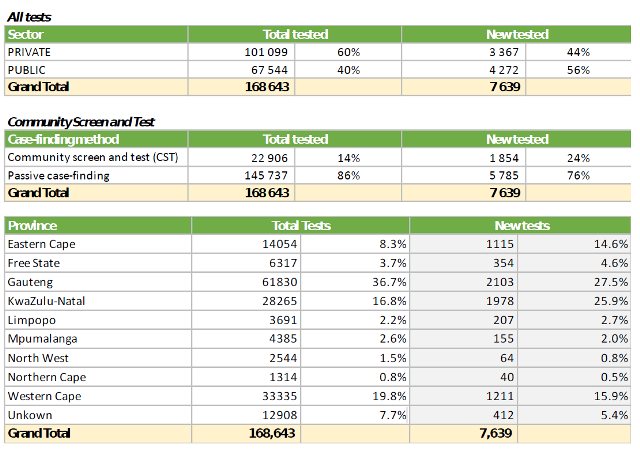
Gauteng is the province where most tests have been conducted, followed by the Western Cape, KwaZulu-Natal, and the Eastern Cape. Relatively few tests have been done in the Free State, Limpopo, Mpumalanga, the Northern Cape and North West.
Testing figures from the Department of Health, covering the period up until the 25th April 2020
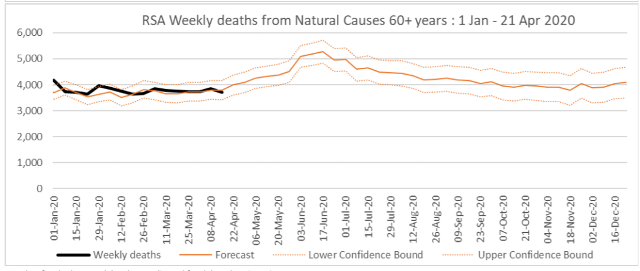
5. Reported deaths from Covid-19 remain low
Although it is a lagging indicator (by a few weeks) the most reliable indicator of the extent of an epidemic in a country is the number of deaths from Covid-19. A reasonable estimate of the mortality rate for the disease is around 1%, though this is far higher for the elderly and those with pre-existing conditions, and close to zero for those who are healthy and under the age of thirty. The rate may be lower than this depending on the degree of asymptomatic transmission.
As noted earlier 93 deaths from the disease have been reported thus far. There is also no sign (yet) of substantial numbers of deaths from the disease not being recorded, as has been the case in the United States, and certain European countries.
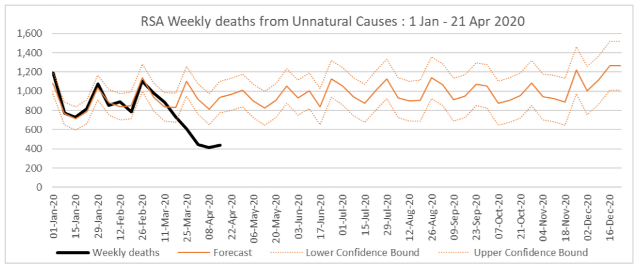
The South African Medical Council, in partnership with UCT’s Centre for Actuarial Research, reports that, up until 21 April 2020, the “number of deaths in the most recent five weeks are lower than predicted as a result of a decline in the number of deaths from non-natural causes (e.g. road traffic fatalities and homicide). See graph at end of report. The decline has been experienced for both males and females. Deaths from natural causes show no unusual sign of increase by 21 April 2020 among people less than 60 years nor those 60 years and over.”
***