
President Zuma's approval level in metro areas steady at 49% as elections loom
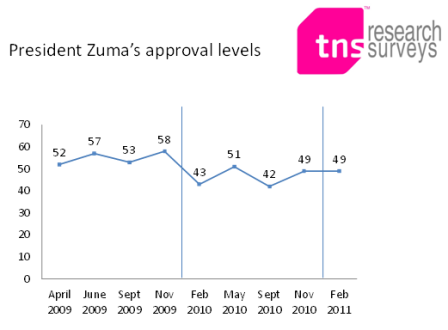
After a year of volatility during 2010, President Zuma's approval level for February 2011 steadied at the same level as at the end of 2010 - 49% of metro adults approve of the way the President is doing his job. This is according to a survey released today by TNS Research Surveys, South Africa's leading marketing and social insights company, which has been tracking approval levels of the incumbent President for many years, including our new president, President Jacob Zuma. The studies are each conducted amongst a sample of 2 000 SA adults from the seven major metropolitan areas of South Africa, interviewing them face-to-face in their homes, with a margin of error of under 2.5%.
The President's approval levels showed considerable volatility during 2010, dropping to 43% in February from an end-2009 high of 58%. May showed a partial recovery but the September figures showed a sharp decline with some recovery in November to 49%, a figure maintained in the first reading for 2011..
|
% |
April 2009 |
June 2009 |
September 2009 |
November 2009 |
February 2010 |
May 2010 |
September 2010 |
November 2010 |
February 2011 |
|
Approve |
52 |
57 |
53 |
58 |
43 |
51 |
42 |
49 |
49 |
|
Disapprove |
29 |
13 |
19 |
23 |
41 |
33 |
44 |
34 |
35 |
|
Don't know |
19 |
31 |
28 |
19 |
17 |
16 |
15 |
17 |
16 |
|
Net positives* |
+23 |
+44 |
+34 |
35 |
+2 |
+18 |
-2 |
+15 |
+14 |
* Net positives are given by subtracting those who feel he is NOT doing a good job from those who feel he IS doing a good job.
The decline in February last year occurred at a time when the President's personal life was very much under the spotlight and there were growing service delivery protests. The May study was conducted just prior to the start of the 2010 FIFA Soccer World Cup, and these issues as well as service delivery protests were much less in the public eye. The September study was conducted during the lengthy public servants' strike during part of which President Zuma visited China with a large trade delegation. The most recent study was conducted in February of 2011.
Who is more or less positive?
Unfortunately, political views in South Africa tend to have a strong correlation with race. This is best illustrated in the following table:
|
% |
Blacks 2009 |
Blacks 2010 |
Blacks 2011 |
Whites 2009 |
Whites2010 |
Whites 2011 |
||||||||||||
|
Apr |
Jun |
Sept |
Nov |
Feb |
May |
Sept |
Nov |
Feb |
Apr |
Jun |
Sept |
Nov |
Feb |
May |
Sept |
Nov |
Feb |
|
|
Approve |
73 |
75 |
67 |
75 |
58 |
67 |
54 |
62 |
63 |
16 |
24 |
29 |
22 |
17 |
19 |
17 |
25 |
22 |
|
Disapprove |
9 |
4 |
9 |
11 |
27 |
18 |
33 |
22 |
22 |
64 |
36 |
43 |
45 |
64 |
60 |
60 |
54 |
60 |
|
Don't know |
17 |
21 |
24 |
14 |
15 |
15 |
13 |
16 |
15 |
21 |
40 |
28 |
32 |
19 |
21 |
23 |
21 |
18 |
|
Net positives* |
+64 |
+71 |
+58 |
+64 |
+29 |
+49 |
+19 |
+40 |
+38 |
-48 |
-12 |
-14 |
-23 |
-47 |
-41 |
-43 |
-29 |
-38 |
|
% |
Coloureds 2009 |
Coloureds 2010 |
Coloureds 2011 |
Indians/Asians 2009 |
Indians/Asians 2010 |
Indians/Asians 2011 |
||||||||||||
|
Apr |
Jun |
Sept |
Nov |
Feb |
May |
Sept |
Nov |
Feb |
Apr |
Jun |
Sep |
Nov |
Feb |
May |
Sep |
Nov |
Feb |
|
|
Approve |
11 |
23 |
31 |
38 |
15 |
23 |
27 |
26 |
25 |
25 |
35 |
38 |
29 |
18 |
43 |
17 |
26 |
36 |
|
Disapprove |
68 |
19 |
26 |
35 |
66 |
59 |
60 |
55 |
59 |
49 |
23 |
35 |
50 |
65 |
48 |
69 |
62 |
45 |
|
Don't know |
21 |
58 |
43 |
27 |
18 |
19 |
13 |
19 |
17 |
26 |
43 |
27 |
21 |
17 |
9 |
14 |
12 |
19 |
|
Net positives* |
-57 |
+4 |
+5 |
+3 |
-51 |
-36 |
-33 |
-29 |
-34 |
-24 |
+12 |
+3 |
-21 |
-47 |
-5 |
-52 |
-36 |
-9 |
* Net positives are given by subtracting those who feel he is NOT doing a good job from those who feel he IS doing a good job.
- The 2011 reading for blacks is effectively unchanged.
- The figures for whites show some decline since the end of 2010
- For coloureds, sentiment has also shifted slightly more negatively.
- For Indians/Asians, a much more positive sentiment is evident for the 2011 figures.
Differences by area
There are usually strong regional differences in such ratings. These are outlined below for 2010 and the first reading for 2011:
|
|
|
|
2010 |
2011 |
|||
|
|
|
|
Feb |
May |
Sept |
Nov |
Feb |
|
Gauteng |
|
|
47 |
57 |
49 |
56 |
56 |
|
|
Johannesburg and environs |
|
50 |
60 |
50 |
59 |
58 |
|
|
|
Johannesburg excl Soweto |
48 |
54 |
53 |
57 |
58 |
|
|
|
East Rand |
54 |
64 |
53 |
68 |
57 |
|
|
|
West Rand |
47 |
62 |
55 |
47 |
47 |
|
|
|
Soweto |
50 |
70 |
59 |
56 |
71 |
|
|
|
Vaal Triangle/South Rand |
49 |
47 |
40 |
48 |
57 |
|
|
|
Pretoria |
35 |
45 |
37 |
45 |
49 |
|
Cape Town |
|
|
23 |
24 |
23 |
27 |
22 |
|
Durban |
|
|
49 |
60 |
41 |
52 |
55 |
|
Eastern Cape |
|
|
39 |
51 |
34 |
40 |
43 |
|
|
Port Elizabeth |
|
36 |
42 |
39 |
43 |
44 |
|
|
East London |
|
47 |
71 |
24 |
35 |
40 |
|
Bloemfontein |
|
|
48 |
65 |
40 |
60 |
59 |
Compared with November 2010, there has been a drop in the East Rand but a rise the South Rand/Vaal Triangle and in Soweto. Overall, Gauteng has the highest approval levels, along with Durban and Bloemfontein. The Eastern Cape and, especially, Cape Town have the lowest.
Other notable differences
In terms of age group, people aged 18 to 34 years are the most positive at 52% whilst those aged 60 years and more are the least positive at 35%. In terms of language group, the most positive are those whose home language is isiZulu at 70%. Of the black language groups, those whose home language is Xhosa have the lowest approval level at 53%.
Our take out
President Zuma's approval levels in metro areas, as measured in February, steadied at 49% after a year of volatile readings. The overall average for 2010 was 46%. A rise in approval amongst Indians/Asians was balanced by small declines amongst whites and coloureds.
Technical note
All the studies were conducted amongst 2 000 adults (1260 blacks, 385 whites, 240 coloureds and 115 Indians/Asians) in the seven major metropolitan areas: it has a margin of error of under 2.5% for the results found for the total sample. The studies use probability sampling techniques and are fully representative of the major metropolitan areas. The studies were conducted by TNS Research Surveys (Pty) Ltd as part of their ongoing research into current social and political issues and were funded by TNS Research Surveys.
About TNS
TNS is the global leader in custom market research delivering actionable insights and research-based business advice to clients around the globe so they can make more effective business decisions. TNS offers comprehensive industry knowledge within the Consumer, Technology, Finance, Automotive and Political & Social sectors, supported by a unique product offering that stretches across the entire range of marketing and business issues, specializing in product development & innovation, brand & communication, stakeholder management, retail & shopper, and qualitative research. Delivering best-in-class service across more than 80 countries, TNS is dedicated to discovering growth opportunities for its clients in an ever-changing world. Through its pioneering and innovative culture, TNS understands the latest marketing challenges and research techniques, being the first to discover and solve new marketing issues for clients.
Issued by Neil Higgs, TNS Research Surveys, March 20 2011
Click here to sign up to receive our free daily headline email newsletter
