
Cyril Ramaphosa popular amongst South Africans, but political parties questionable
A majority of six in every ten (62%) South Africans think President Cyril Ramaphosa is doing his job well.
A majority of six in every ten (62%) South Africans think President Cyril Ramaphosa is doing his job well. This is despite the almost four in ten (39%) saying that there is no political party in the country representing their views. These are some of the most important findings from a Pulse of the People™ survey conducted by Ipsos towards the end of 2019.
Asked whether the president does his job “very well”, “fairly well”, “not very well” or “not at all well”, a quarter (25%) gives him top marks, and another 37% also feel positive:
|
How well is the president doing his job? |
||
|
|
% |
% |
|
Very well |
25 |
62 very well + fairly well |
|
Fairly well |
37 |
|
|
Not very well |
17 |
30 not very well + not at all well |
|
Not at all well |
13 |
|
|
Don’t know/ Refused to answer |
8 |
|
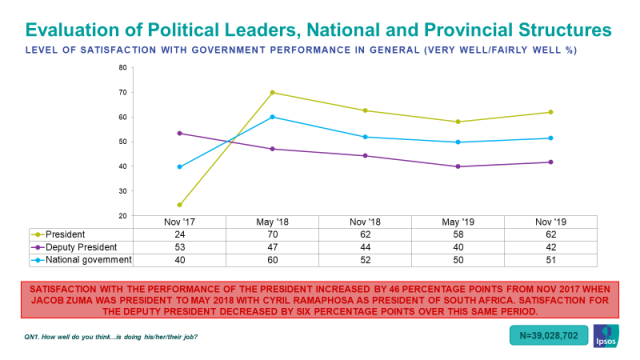
Placing these results against the background of the last three years, it is clear from the graph overleaf that South Africans have expressed a lot more appreciation for the leadership of President Ramaphosa than for President Zuma (who stood at 24% for doing his job well a few weeks before the Nasrec conference in 2017).
However, there is definite room for improvement as president Ramaphosa had a higher approval rating just after he took the highest office in the land – 70% at the time. After the Zuma years South Africans were expecting great things from the new president. Like previous ANC leaders including Presidents Mandela and Mbeki, president Ramaphosa also gets a higher approval rating than the National Government (at 51%). South Africans still expect their president to take action to have an influence on the future:
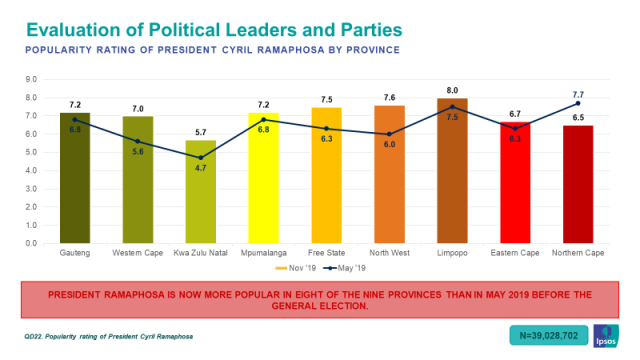
In another measurement, when asked to allocate points out of 10 to political leaders, the president was given a score of 7 out of 10. Looking specifically at the provincial results from May 2019 and November 2019, the graph below makes it clear that the president is now doing better than just before the May 2019 election in eight out of the nine provinces. The exception is the Northern Cape, where the celebrations of the ANC’s birthday in January and the president’s interaction with voters on the ground could have had an influence – this will be measured again in May this year.
Looking at the relative strength of political parties six months after the May 2019 election, support for all three of the biggest parties shrunk, while the IFP and FF+ maintained their positions.
During the field work interviews, respondents complete a ballot paper to indicate their choice of party – thus imitating a “secret vote”. However, it is extremely important to keep in mind that these results (below) are for all South Africans 18 years and older – thus all eligible to vote and not only for those who turn out to vote.
In the May 2019 election, roughly about 10 million South Africans were not registered to vote and another 10 million did not turn out to vote.
|
Party choice November 2019 |
% |
|
ANC |
55 |
|
DA |
13 |
|
EFF |
8 |
|
IFP |
2 |
|
FF+ |
1 |
|
Other party chosen |
3 |
|
WILL NOT VOTE |
6 |
The proportion of trust expressed in the three biggest political parties in the country differ widely, echoing the support levels discussed above:
|
|
Trust score / Index
|
|
Trust the ANC |
23.63 |
|
Trust the DA |
-24.05 |
|
Trust the EFF |
-23.24 |
As alluded to above, political parties do not seem to evoke strong and growing support and almost four in ten (39%) South Africans eligible to vote “strongly agreed” or “agreed” with the statement: “There is no political party that represents your views”.
This feeling was strongest in Mpumalanga, Limpopo and the Western Cape. It is clear where political parties need to spend their energies and build trust before next year’s local government elections:
|
There is no political party that represents your views |
Strongly agree/Agree % |
|
Mpumalanga |
51 |
|
Limpopo |
46 |
|
Western Cape |
44 |
|
Gauteng |
41 |
|
Northern Cape |
41 |
|
KwaZulu-Natal |
36 |
|
Eastern Cape |
34 |
|
Free State |
25 |
|
North West |
25 |
Before these local government elections, the institution of municipalities need attention. A question on the level of trust in various institutions was included in the survey and a simple index developed.
According to this, local governments/municipalities are trusted much less by the electorate than provincial governments or Parliament:
|
|
Trust score / Index |
|
Trust my Local Municipality |
4.45 |
|
Trust the Government of my Province |
15.86 |
|
Trust Parliament |
20.6 |
Technical Detail
In-home and in home language, face-to-face interviews with a randomly selected sample of 3,600 adult South Africans are conducted. Results are weighted and projected to the universe, i.e. the adult South African population. Thereafter results are filtered to show only results of those 18 years and older – i.e. eligible to vote.
Interviews were done in all types of geographies – from big cities to remote rural areas and the results are representative of the views of the South African population of voting age.
Fieldwork was done from 20 September to 8 November 2019.
The margin of error of the study depends on the sample size, response rate and survey methodology used and is between 0.65 and 1.75 for the sample as a whole at a 95% confidence level.
Issued by Mari Harris – Senior Client Officer, Ipsos, 11 February 2020
