
Extract from the Draft Organisational Report to COSATU's 11th Congress, August 24 2012:
MEMBERSHIP AND RECRUITMENT
2.1 Membership statistics
2.1.1 The 2015 Plan adopted by the 8th National Congress in 2003 set a target for increasing membership by 10% every year, working towards the target of 4 million in 2009.
2.1.2 By the 10th Congress in 2009, COSATU had a membership of 1.97 million, a far cry from the 4 million member target. While not achieving the target, COSATU had nevertheless grown by 200,000 members in the period since the adoption of the 2015 Plan in 2003 - a growth of 11% over the period.
2.1.3 Declared membership for 2012 stands at 2.2 million (2,191,016).
Whilst still not achieving the 4 million member target, this nevertheless represents a growth of a further 230,000 since 2009.
This is an increase of 11.7% between Congresses. The growth between 2009 and 2012 is the highest rate of growth for an inter-Congress period since 1997.
2.1.4 Since the 10th Congress in 2009 there has been growth in every affiliate except CWU, SADNU and SASAWU. The following affiliates grew by 15,000 or more members: - CEPPWAWU, NEHAWU, NUM, NUMSA, POPCRU, SADTU, SAMWU and SATAWU. None of the affiliates however met the 2015 Plan target of 10% annual growth.
Affiliate membership 1991 - 2012
|
1991 |
1994 |
1997 |
2000 |
2003 |
2006 |
2009 |
2012 |
|
|
CEPPWAWU |
88000 |
78000 |
94000 |
74000 |
65000 |
62000 |
64182 |
80658 |
|
CWU |
21000 |
23000 |
40000 |
35000 |
32000 |
25000 |
29699 |
18666 |
|
CWUSA |
n/a |
n/a |
n/a |
n/a |
n/a |
n/a |
370 |
|
|
DENOSA |
n.a |
n.a. |
73000 |
70000 |
71000 |
64000 |
68450 |
74883 |
|
FAWU |
129000 |
121000 |
140000 |
119000 |
119000 |
115000 |
118974 |
126930 |
|
NEHAWU |
18000 |
64000 |
163000 |
235000 |
235000 |
204000 |
230445 |
260738 |
|
NUM |
270000 |
311000 |
311000 |
290000 |
279000 |
262000 |
272000 |
310382 |
|
NUMSA |
273000 |
170000 |
220000 |
200000 |
173000 |
217000 |
236909 |
291025 |
|
PAWUSA |
n.a |
n.a. |
n.a. |
n.a. |
n.a. |
17000 |
16169 |
17146 |
|
POPCRU |
n.a |
n.a |
45000 |
71000 |
67000 |
96000 |
125732 |
149339 |
|
SACCAWU |
97000 |
102000 |
102000 |
102000 |
102000 |
108000 |
115488 |
120352 |
|
SACTWU |
186000 |
150000 |
150000 |
120000 |
105000 |
110000 |
85000 |
85025 |
|
SADNU |
n.a |
n.a. |
n.a. |
8000 |
8000 |
9000 |
9093 |
8655 |
|
SADTU |
n.a |
59000 |
146000 |
219000 |
215000 |
224000 |
236843 |
251276 |
|
SAFPU |
n.a |
n.a. |
n.a. |
n.a. |
n.a. |
1000 |
472 |
593 |
|
SAMA |
n.a |
n.a. |
n.a. |
n.a. |
n.a. |
5000 |
7246 |
7759 |
|
SAMWU |
60000 |
100000 |
117000 |
120000 |
120000 |
118000 |
135906 |
153487 |
|
SASAWU |
n.a |
n.a. |
n.a. |
18000 |
18000 |
9000 |
7804 |
7074 |
|
SASBO |
n.a |
n.a |
70000 |
63000 |
63000 |
61000 |
66093 |
67402 |
|
SATAWU |
70000 |
74000 |
91000 |
103000 |
74000 |
133000 |
140392 |
159626 |
|
GRAND TOTAL |
1212000 |
1252000 |
1791000 |
1869000 |
1768000 |
1841400 |
1974084 |
2191016 |
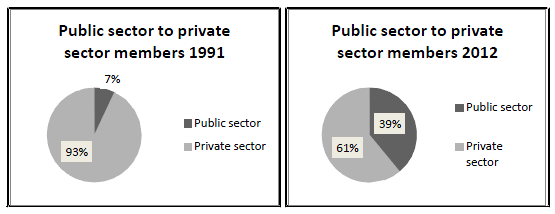
The proportion of public to private sector membership has shifted from 7% public sector in 1991 to 39% in 2012.
2.2 Membership gains and losses
2.2.1 Of course absolute growth or shrinkage does not tell us immediately how many new members a union has recruited, and how many members the union has actually lost. At any one time a union will be signing up new members and members will be leaving the union through dismissal, resignation from work, retirement, and resignation from the union. To really make sense of membership data, we have to know more about these movements.
2.2.2 The NALEDI State of Affiliates Survey asked affiliates to indicate numbers of new recruits, and numbers of member losses and the reasons for these losses. Only nine affiliates were able to give any such data, and even then, it was incomplete. Broadly speaking, from the data that was provided, membership gains are twice as big as membership losses. However, worryingly, most losses were due to resignation from the union, followed by retrenchments. "Resignation from the union" indicates a voluntary act driven by dissatisfaction with service.
2.3 Trade union density
2.3.1 In order to assess its potential for growth, any affiliate needs to know what proportion of the workforce in the sector it has recruited at any one time. This is what is referred to as trade union density.
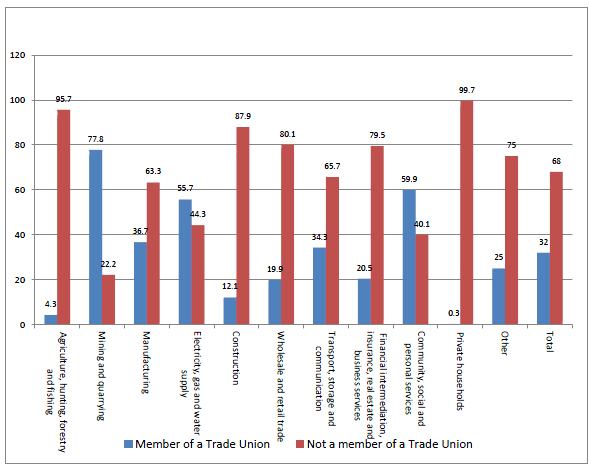
2.3.2 According to StatsSA, the current overall trade union density in South Africa is 32%. By international standards this is reasonable, but by our own standards it is not good enough. In order to make a significant difference to the lives of all workers, we need to do much better than that.
2.3.3 The sectoral categories provided by StatsSA do not completely coincide with our own categories of sector and union. In addition, the percentages of unionisation reflect membership across all unions in
the particular sector. For some of our sectors however, the figures give us a very clear indication of the penetration of our affiliates. The table below shows us clearly that:-
- Union density is highest in the mining and quarrying sector, at 78%
- Second place in terms of union density is in the public sector -60% in community, social and personal services and 56% in electricity, gas and water supply
- Union density in manufacturing (all sectors) is just above average, at 36%
- Union density is lowest in domestic service (0.3%) followed by the agriculture sector (4.3%)
Trade Union Density by Industry1
2.4 Demographics of membership
It is critical to monitor the demographics of membership in a union. Data on age, gender, income bracket, skill level, educational level, and race, type of employment and size of employer begins to tell us something about what our members' needs and interests might be, and also where we need to put more effort into recruitment and servicing.
Unfortunately most affiliates do not have systems of producing data on demographics. Only nine affiliates were able to provide age and gender demographic data for the NALEDI State of Affiliate Survey.
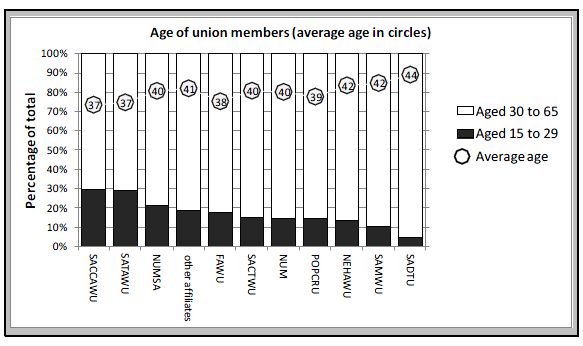
2.4.1 Age of union members in COSATU Affiliates
Where age data was provided in the NALEDI State of Affiliates Survey it shows that young workers are under-represented in COSATU, with most of the affiliates that responded having less than 20% young members. SAMA was the exception, however, with 60% of its membership under 30 years of age.
The data from the 2012 COSATU Workers' Survey confirms this worrying under-representation of young workers. According to this data, SACCAWU and SATAWU had 30% young workers, NUMSA had around 20% young workers, and the majority of COSATU affiliates had between 10-20% young members. SADTU had less than 5% young members. Overall the survey found that only one in seven COSATU members were under the age of 30, whereas 1 in 3 of the unorganised workers was under the age of 30 years. The survey also found that the average age of members to be 40.
These statistics on age should be a real wake-up call for us. We are clearly not doing enough to attract young workers.
2.4.2 Women members in COSATU Affiliates
Affiliates' collection of gender data is even worse than our collection of age data. In 2010 fifteen affiliates supplied gender data, but in 2012 only eight affiliates were able to supply a gender breakdown for their 2012 membership. The table below gives the 2010 and 2012 data provided. Affiliates that do not feature in the table did not supply data in 2010 or 2012.
The membership gender data only truly begins to make sense when we look at it together with data on women employed in the sectors. The data on the sectors is taken from Stats SA 2012. The correlation between the Stats SA sectors and our union sectors is not identical, so the comparisons are indicative rather than exact. The comparisons are useful nevertheless. They show us that women are still under-represented in terms of union membership in the manufacturing, mining, and construction sectors. The only sectors where women membership matches women's employment are the wholesale and retail sector and the social services sector.
Percentage Women Union Membership 2010 and 2012 compared to women employed in the sector
|
Union |
% Women Members 2010 |
% women members 2012 |
Proportion of women in the sector |
|
CEPPWAWU |
21% |
22% |
Manufacturing 30% |
|
CWU |
41% |
56% |
Transportation, storage & communication 26% |
|
DENOSA |
85% |
91% |
Social and personal services 59% |
|
NEHAWU |
54% |
Social and personal services 59% |
|
|
NUM |
9% |
Construction 16% / Mining 13% |
|
|
NUMSA |
16% |
Manufacturing 30% |
|
|
PAWUSA |
60% |
Social and personal services 59% |
|
|
POPCRU |
30% |
37% |
Social and personal services 59% |
|
SACCAWU |
61% |
55% |
Wholesale and retail 47% |
|
SACTWU |
85% |
Manufacturing 30% |
|
|
SADTU |
65% |
Social and personal services 59% |
|
|
SAMA |
48% |
51% |
Social and personal services 59% |
|
SAMWU |
35% |
Social and personal services 59%/ Electricity, gas and water 16% |
|
|
SASAWU |
53% |
54% |
Social and personal services 59% |
|
SASBO |
68% |
68% |
Finance & insurance 45% |
The gender data tells us that we have to re-double our efforts to recruit women workers, and it also tells us that we have a long way to go in achieving gender equity in employment itself.
Knowing that membership data on income bracket, skill level, educational level and race would be even more difficult to extract directly from affiliates than data on gender and race, the NALEDI State of Affiliates Survey did not ask for this. However the COSATU Workers' Survey results do give us some useful information.
2.4.3 Skill level of COSATU members (self-categorisation) Workers' Survey 2012
|
Skill level |
Percentage of COSATU members |
|
Elementary workers or labourers |
38% |
|
Skilled production workers |
28% |
|
Clerical or sales workers |
13% |
|
Professionals /teachers/nurses |
19% |
|
Management |
2% |
These figures tell us that while the bulk of our membership is labourers, skilled workers and clerical or sales workers, we have a significant number of members (21%) who are professionals or management. We have to think about whether our organising strategies take this skills range into account. NUMSA and NUM have both reported that they have developed strategies to address the needs of artisans and technical workers.
2.4.4 Income level of COSATU members (self-categorisation) Workers' Survey 2012
|
Monthly earnings |
COSATU members |
Non-Unionised workers |
|
Less than R1500 |
4% |
18% |
|
R1500 - R2500 |
18% |
24% |
|
R2500 - R5000 |
24% |
34% |
|
Above R5000 |
52% |
22% |
These figures tell us two things in combination:-
- A significant number of our members - approximately half a million - earn less than R2500 a month
- Joining a COSATU union is likely to result in better pay. We would hope so, given that collective bargaining is a core function of affiliates!
- We are not reaching out sufficiently to recruit low paid workers, even amongst those with formal employment
Drilling down to the sectors, the COSATU Workers' Survey confirms that the worst paid union members are in retail, private services (including security) and light industry. The best paid are in the public services, where the majority of members are in the big public-service professions - education, health and policing.
2.4.5 Education levels of COSATU members: Workers' Survey 2012
|
Education level |
COSATUmembers |
Non-Unionised workers |
|
No education, some primary, or completed primary |
9% |
13% |
|
Some secondary |
30% |
37% |
|
Completed matric |
36% |
34% |
|
Diploma after matric or FET diploma |
19% |
9% |
|
University or technikon degree |
10% |
6% |
These figures tell us a number of things:-
- We have a significant number of members who have low levels of education. 39% of our members have not completed secondary school. We need to seriously take this into account in our communications with members - language used, literacy levels, numeracy levels etc
- A disproportionate number of formal workers with low levels of education are still not unionised. 50% of workers who have not completed secondary school are not organised. We need to do more to attract and service these workers.
2.4.6 Race of COSATU members: Workers' Survey 2012
|
Race of COSATU members |
Percentage COSATU members by race |
Percentage members of non COSATU unions by race |
Percentage South African workforce by race |
|
African (South African) |
80% |
62% |
70% |
|
Coloured |
14% |
19% |
11% |
|
Asian or Indian |
4% |
9% |
4% |
|
White |
1% |
8% |
15% |
|
Not South African |
1% |
1% |
The data shows us that relative to the demographics of the South African workforce, and relative to trade unions that are not affiliated to COSATU, we are doing poorly in achieving our ambition of a non-racial trade union movement. The only race group where our membership matches the demographics of the workforce as a whole is Asian/Indian. We have made almost no inroads into recruiting White workers. We need to pay urgent attention to the recruitment of white and coloured workers.
2.4.7 Type of employment of members: Workers' Survey 2012
According to Stats SA's Quarterly Labour Force Survey (1st Quarter 2012), 95% of union members have permanent positions compared to half of non members. This figure is confirmed by the COSATU Workers' Survey which indicates that 92% of COSATU members have permanent positions. However in some unions such as SACCAWU, SATAWU and FAWU the share of members in non-permanent positions is much higher.
|
Affiliate |
% of members not permanent |
% employed through3rd party |
|
Non unionised workers |
39% |
11.5% |
|
Total COSATU |
8% |
3.5% |
|
SACCAWU |
17% |
4% |
|
SACTWU |
16% |
4% |
|
SATAWU |
11% |
12% |
|
FAWU |
11% |
5.5% |
|
SAMWU |
10% |
0% |
|
NUM |
9% |
1% |
|
NUMSA |
8% |
3.5% |
|
NEHAWU |
5% |
2% |
The data shows that we are failing to make significant inroads into recruiting and organising contract workers and those employed through a third party (labour brokers and/or outsourced). This is despite the strategies reported by affiliates in the NALEDI State of Affiliates Survey. NUM, NEHAWU, SAMWU, SATAWU, SACCAWU, FAWU, DENOSA and SACTWU all report that they have adopted conscious strategies to recruit casual, contract and part-time workers.
2.5 Rival unions
2.51 According to the Department of Labour's published statistics, there were 193 registered unions in South Africa in July 2012. 117 of these are independent of any registered trade union Federation.
2.5.2 There is no available published data on the size of each registered union. Affiliates are usually aware of who their significant rivals are, but what is often not analysed or taken into account in developing organising and servicing strategies is the combined competition from a multiplicity of small unions.
2.5.3 The table below categorises registered unions per sector, based on their registered names. Some unions may be registered for more sectors than their name suggests however.
2.5.4. It should be noted that there are 45 general unions, the largest of which are UASA and Solidarity. Most of the other general unions are fairly small and locally based, with names such as Workers Against Regression (WAR), Westcoast Workers' Union, United Workers Front, Togetherness Amalgamated Workers' Union of SA (TAWUSA), Ubuntu Labour Organisation of SA (ULOSA), National Democratic Change
and Allied Workers Union (NDCAWU), and Labour Equity General Workers Union of SA (LEWUSA). Most of these unions focus their recruitment in the low paid sectors.
2.5.5 It should also be noted that sectors where there is a significant multiplicity of registered unions are: - Retail/hospitality, cleaning, security, construction, food/fishing, transport, and tertiary education. Apart from tertiary education, all these sectors have a predominance of low paid and vulnerable workers. Apart from tertiary education and food/fishing, they are also very large sectors. We know already that union density is low in these sectors. But this tells us that the huge space that exists for recruitment is currently being taken up, in significant part, by small local independent unions. We are clearly not being responsive enough in these vulnerable sectors, either as affiliates or as COSATU as a whole.
Numbers of registered unions per sector, identified rivals to COSATU affiliates, and their declared membership (Department of Labour figures 2010 or 2011 depending on which are most recent)
|
Sector |
Total registered trade unions |
Rivals to COSATU affiliate/s - for reasons of size, public profile, and/or because they are a splinter union |
Rival union membership |
||
|
Banking |
3 |
IBSA (Fedusa) |
7963 |
||
|
Chemical, Paper, Wood, Printing |
13 |
SACWU (Nactu) |
16055 |
||
|
GIWUSA (Indep) |
13581 |
||||
|
SATU (Fedusa) |
11344 |
||||
|
Cleaning |
8 |
SACSAAWU (Indep) |
3291 |
||
|
Communication |
2 |
SACU (Fedusa) |
5136 |
||
|
Construction |
12 |
AUBTW (Indep) |
3519 |
||
|
BAMCWU (Indep) |
3450 |
||||
|
Creative arts |
2 |
||||
|
Education (Teachers) |
9 |
NATU (Fedusa) |
52864 |
||
|
PEU (Consawu & Nactu) |
15780 |
||||
|
NAPTOSA (Indep) |
52920 |
||||
|
Suid Afrikaanse Onderwysers Unie (Fedusa) |
32029 |
||||
|
Farms |
4 |
Sikhula Sonke (Indep) |
5050 |
||
|
BAWSI Agricultural Workers Union (Indep) |
3514 |
||||
|
Food2, fishing |
12 |
Food & General Workers Union (Indep) |
6010 |
||
|
NUFWBSAW -FoodBev (Nactu) |
10214 |
||||
|
Health |
5 |
HOSPERSA (Fedusa) |
64742 |
||
|
Media, Communications, Postal |
5 |
MWASA (Nactu) |
2347 |
||
|
SACU (Fedusa) |
5136 |
||||
|
SA Post Workers Union SAPWU(Indep) |
4730 |
||||
|
Metal, Electrical, motor |
6 |
MEWUSA (Nactu) |
17180 |
||
|
Motor Ind Staff Assoc MISA (Fedusa) |
30039 |
||||
|
Mining |
4 |
AMCU |
9489 |
||
|
Solidarity/MWU (Consawu) |
|||||
|
UASA (Fedusa) |
|||||
|
Municipal |
3 |
IMATU (Indep) |
|||
|
Police, correctional services |
3 |
SAPU (Indep) |
68424 |
||
|
Public sector |
8 |
PSA (Indep) |
|||
|
NUPSAW (Consawu) |
31482 |
||||
|
NPSWU (Nactu) |
7142 |
||||
|
Retail, catering, hospitality |
13 |
HOTELLICA (Nactu) |
6098 |
||
|
FEDCRAW (Nactu) |
4829 |
||||
|
ICAWU (Nactu) |
3213 |
||||
|
Security |
15 |
SAPSWU (Indep) |
2426 |
||
|
Kungwini Amalgamated KAWU (Indep) |
19528 |
||||
|
SOCRAWU |
3494 |
||||
|
NASUWU (Fedusa) |
9534 |
||||
|
PROWU (Indep) |
16975 |
||||
|
DUSWO (Indep) |
6002 |
||||
|
Sports |
4 |
||||
|
Tertiary staff3 |
13 |
National Tertiary Education Union (Indep) |
5155 |
||
|
Textile, clothing |
4 |
NULAW (Fedusa) |
7824 |
||
|
Transport |
12 |
UTATU (Fedusa) |
27000 |
||
|
PTAWU (Fedusa) |
17600 |
||||
|
TOWU (Nactu) |
2580 |
||||
|
TAWU (Nactu) |
13085 |
||||
|
Aviation Union of SA (Indep) |
1424 |
||||
|
Air Line Pilots Assoc (Indep) |
1591 |
||||
|
Domestic |
1 |
||||
|
Ministers of Religion |
1 |
||||
|
Trade Union Officials |
1 |
||||
|
Jewellers |
1 |
||||
|
Laundry |
1 |
||||
|
Emergency Personnel |
1 |
||||
|
Call Centres |
1 |
||||
|
Legal |
1 |
||||
|
Museums |
1 |
||||
|
General unions |
45 |
UASA - The Union (Fedusa) |
74138 |
||
|
Solidarity/MWU (Consawu) |
117053 |
||||
2.6 Affiliate Recruitment Strategies
2.6.1 The NALEDI State of Affiliates Survey has surfaced some interesting recruitment strategies. These include:-
- Recruitment drives during strikes (NUMSA and SATAWU) Paying retrenched workers a stipend to recruit (NUMSA) Targeting sectors with most growth potential (NEHAWU) Providing cash incentives to members to recruit (POPCRU)
- A national team of recruiters who operate from a branded vehicle (SATAWU)
- Ad-hoc teams to target identified national companies (SACCAWU) Use of shopping mall committees to recruit across companies (SACCAWU)
- A call centre to follow up resigned members (SASBO)
- Incentive scheme for "Best organiser" (SASBO
- Door-to-door recruitment at learning institutions (DENOSA and SAMA)
- Regional "growth organisers" (SACTWU) Contract recruiters (SACTWU)
- Weekly recruitment tele-conferences to track progress and strategise (SACTWU)
2.6.2 What this tells us is that there is no shortage of ideas and experiments in new ways of recruiting. However, despite the attempts of most Provinces to facilitate the sharing of these ideas, strategies remain largely confined to individual unions. There is an urgent need for cross-affiliate sharing of ideas on recruitment at national, provincial and local level if we are to reach the 4 million target. Such sharing should also extend to the sharing of material and human resources, especially in rural areas where worker density is low.
2.6.3 The starting point for developing shared strategies is the regular updating and sharing of membership data. The Federation adopted a recruitment framework that amongst other things required unions to provide membership data every two months. This was frustrated by the lack of compliance by affiliates, which in turn lead to the framework being abandoned.
2.7 Summary and recommendations: Membership recruitment
1. Even the biggest and most stable affiliates are unable to produce detailed membership data. With modern information technology we should be able to produce data which at the very least gives us ages and gender (based on ID numbers), but this is not the case
There is an urgent need to convene a forum of those people who are familiar with their union's membership system. At minimum we should share best practice and ideas on systems. The first prize would be to work towards a common system.
We are only half way to achieving our 4 million target.
We need to convene a forum of national affiliate organisers and COSATU provincial organiser/educators to share ideas on recruitment strategies
Develop a national recruitment plan based on data collected by the two NALEDI surveys. Such a plan must take into account the identified issues of gender, age, skill, education level, type of employment, and race.
1 Statssa Quarterly Labour Force Survey, Q1, 2012 http://interactive.statssa.gov.za:8282/webview/
Issued by COSATU, September 9 2012. The full report can be accessed by clicking the link below.
Click here to sign up to receive our free daily headline email newsletter

