
Report on Weekly Deaths in South Africa
In the context of the emerging COVID-19 pandemic, it has become essential to track the weekly number of deaths that occur. Deaths recorded on the National Population Register are provided to the SAMRC on a weekly basis. These have been scaled up to estimate the actual number of deaths by accounting for the people who are not on the population register and the under-registration of deaths.
The estimated numbers are compared with the number that would be expected based on the historical data from 2018 and 2019. The number of deaths of persons 1-year and older are reported because birth registration was put on hold during lockdown stage 5 affecting the number of infant deaths recorded on this system. The start date of each week is represented on the graph.
View the latest report:
Weekly Report for 1 Jan – 29 December 2020
***
Trends:
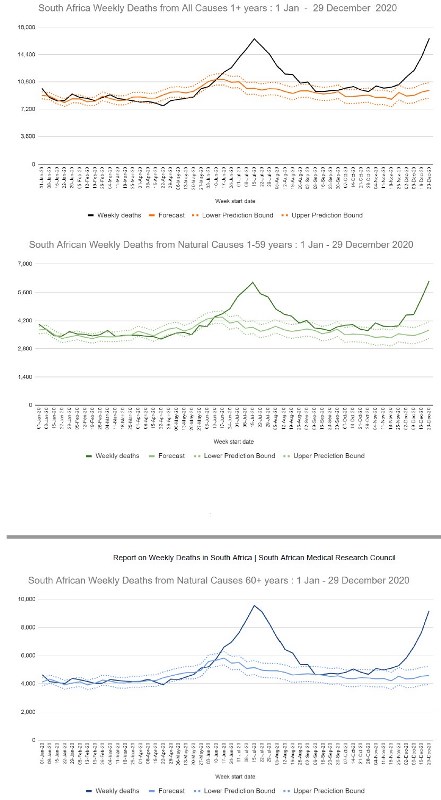
The weekly number of deaths of persons 1+ years of age from all causes continued to increase in the week
23 - 29 Dec with the country experiencing a record number of 16,532 deaths in a single week.
During the week including Christmas the number of natural deaths exceeded the predicted number by 84%, resulting in an excess of 6,974 deaths from natural causes among persons 1+ years.
During the period, 6 May – 29 December 2020, there have been a total of 71,778 excess deaths from natural causes of persons 1+ years old, using the revised base accounting for lower mortality during lockdown. For people 1-59 years the excess is 25,292 and 44,482 for people 60+ years.
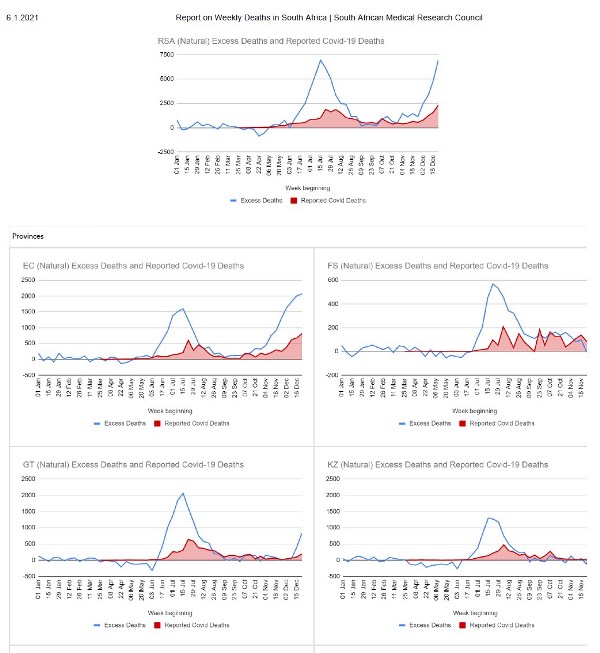
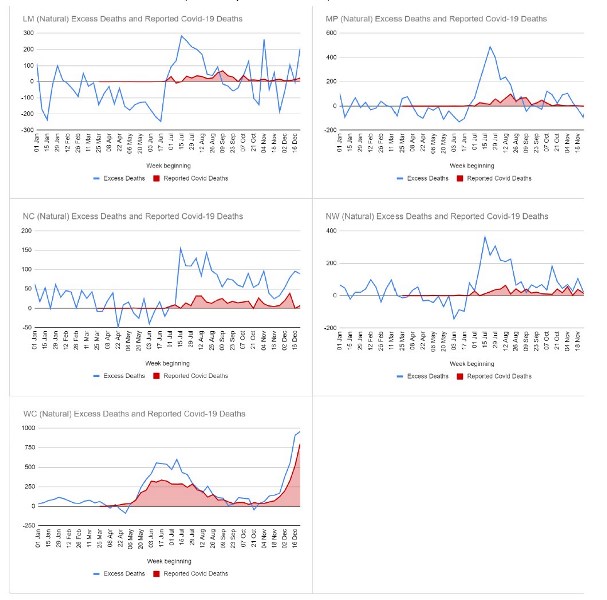
Deaths from natural causes in the Eastern Cape have continued to increase slowly with 2,069 excess natural deaths experienced in the week 23 - 29 Dec compared to 2,013 in the previous week and may be showing the early signs of turning. The numbers of deaths in the 2nd wave is considerably higher than the number of excess natural deaths that occurred in the peak of the 1st wave in the province (1,597).
Natural deaths in Nelson Mandela Bay have continued to decrease and the 2nd wave in Buffalo City is showing signs of peaking but has not yet turned.
KwaZulu Natal has experienced a rapid increase in natural deaths. The number of excess natural deaths in the week of 23 – 29 Dec reached a record high of 2,052 (fast approaching double compared with 1,306 at the peak of the 1st wave). The number of deaths from natural causes in eThekwini has also increased rapidly reaching 651 excess natural deaths, considerably higher than the peak of the 1st wave when there were 363 excess deaths.
Natural deaths in the Western Cape have continued to increase rapidly, with 950 excess natural deaths occurring during the week of Christmas. There are indications of a slow-down in the increase, but the number of deaths is more than 50% higher than the peak of the 1st wave (601). The number of natural deaths in the City of Cape Town has also increased rapidly with a record number of excess deaths.
Deaths from natural causes have increased in Gauteng in the past two weeks. There were more than double the number of excess deaths in the past week (838) compared to the week before (401). Similar upticks have been experienced in the City of Johannesburg, Ekhuruleni and the City of Tshwane.
Increases natural deaths have been experienced across all of the remaining provinces.
The weekly number of deaths from unnatural causes in the week 23 – 29 Dec was below the predicted number, as it was the week before, but still above the lower prediction bound.
***
Estimated number of excess natural deaths of persons 1+ years by province and metro, South Africa 2020
Cumulative Weekly : Excess deaths
|
Region |
Excess deaths 6 May - 29 December |
|
South Africa |
71,778 |
|
Province |
|
|
Eastern Cape |
22,530 |
|
Free State |
5,088 |
|
Gauteng |
14,110 |
|
KwaZulu-Natal |
11,894 |
|
Limpopo |
2,325 |
|
Mpumalanga |
3,338 |
|
Northern Cape |
1,964 |
|
North West |
3,110 |
|
Western Cape |
9,768 |
|
Metropolitan Municipality |
|
|
Buffalo City |
2,677 |
|
City of Cape Town |
6,736 |
|
Ekhuruleni |
4,042 |
|
eThekwini |
2,952 |
|
Johannesburg |
4,651 |
|
Mangaung |
1,223 |
|
Nelson Mandela Bay |
4,583 |
|
City of Tshwane |
2,718 |
One approach to aid understanding of the emerging COVID-19 mortality is to compare the estimated weekly excess deaths with the number of COVID-19 deaths reported by the Minister of Health as shown in the figure below.
This comparison is hampered to some degree by the fact that the excess deaths are classified by week in which the death occurred; the reported COVID-19 deaths are classified by date the numbers are reported to the Department. If all excess natural deaths were due to COVID-19, and all COVID-19 deaths were perfectly identified and reported, the two series would be identical.
The number of estimated excess deaths has begun to decrease, consistent with the trend in the number of confirmed COVID-19 deaths. Although more data are needed on the underlying causes of death, this observation is strongly supportive that a significant proportion of the current excess mortality being observed in South Africa is likely to be attributable to COVID-19.
***
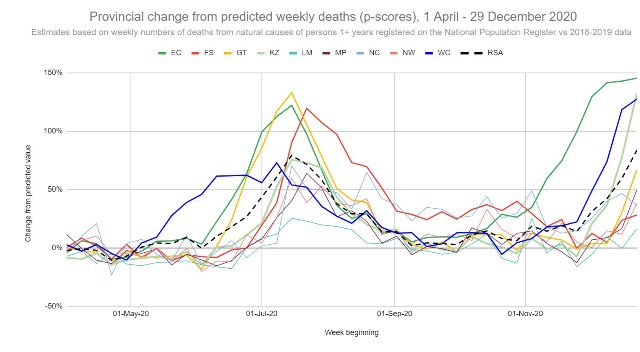
The P-Score is another measure frequently used to describe excess mortality on a weekly basis. It is the percentage change in the number of deaths from the expected number for that week. Negative values below 0% reflect a deficit in deaths while positive values reflect an increase. This graph shows the percentage change between the estimated number of deaths from natural causes and the predicted number based on the historical data.
Issued by the SAMRC, 6 January 2021
