
Consumer impact of the Gauteng Freeway Improvement Program: Prepared for the Road Freight Association and AfriForum by Economists.co.za, April 5 2011
The Gauteng Freeway Improvement Project ("GFIP") is an investment much needed for the improvement of economic infrastructure of South Africa's most economic active province. However, much of the economic benefit of the project will disappear if toll fees are set at inappropriate levels. This study provides an initial assessment of the likely impact of the GFIP on the national and regional economy. While the research team had to make many assumptions, we have wherever possible used actual figures that the South African National Roads Agency (Sanral) has provided to the public. Sanral has however not always explained how some figures were obtained or indeed why the actual tariffs are what they have announced.
At a proposed cost of 66 cents per kilometre for cars (compared to the initial 12 cents before the project started) and R3.96 for heavy trucks, the GFIP toll fees are the highest in South Africa, set for the busiest road network in the country. This in itself is sufficient cause for concern. Moreover, very little data is available on how toll fees are calculated.
However, it is safe to assume that toll fees are at least partially influenced by the need to repay construction and financing costs. In this sense an examination of the GFIP construction costs suggests that the per kilometre cost is extremely high - possibly as much as 106% to 228% higher than that of equivalent international projects.
Implementation of a user pays principle in infrastructure project funding and financing should increase the perceived "fairness" of how such projects are paid for. However, analysis of the toll fee burden shows that the toll fees are equal to an increase of 2% in the personal income taxes of Gauteng residents. This does not include the consumer price effect as toll fees are not part of the current inflation basket.
For the commercial road freight industry the expected income from toll fees is equal to at least an increase of 10% in taxation. This could however be as high as a 30% company tax increase as the total sector which includes communications and storage paid equals about R12 billion in paid company taxes for 2008. The GFIP costs that the Commercial Road Freight Industry will pay every year, is R1,2 billion. This may even affect some of the weaker companies' ability to survive.
Many everyday products will also experience price inflation as a result of the impact of GFIP tolls on transport costs. Though the total consumer price inflation impact will only be around 0.4%, the impact on the poor will be much larger - as the toll fees will effect disproportionately large increases in a number of items consumed by the poorest consumers. To illustrate this trend, an analysis was done on specific cost increases in prices of three everyday items: milk, bread and petrol. The item to experience the largest cost increase is a cheap loaf of bread, the price of which will increase by 2%.
The repayment period and the cost of capital also indicate that the amount Sanral expects to collect from GFIP users would be enough to pay back the project's high costs within a period of 11,1 years (conservatively speaking). It may even be possible to pay the loans back in less than 9 years. Both of these calculations do not take toll fees increases over the next few years into account. Publicly available data indicate that the toll income will be more than needed to pay a loan back in 20 years.
The magnitudes of the above costs can be ascribed to among others the monopolistic pricing power of Sanral. As South Africa does not possess a transport regulating authority, pricing abuse in the determination of toll fees is possible.
The economic costs of the GFIP will be high and negatively impact business and everyday life in the province. However, the full impact of the tariffs cannot be fully understood until Sanral provides enough data to allow for a comprehensive independent review.
The findings confirm that more attention should be paid to the process by which toll levels are determined, in order to ensure that the costs of the project to the national and regional economy are minimised. As such the government should consider establishing a transport regulating authority in order to oversee and regulate toll tariffs in South Africa.
The provision of sufficient economic infrastructure in Gauteng is critical for the local and national economy, as the province is a hub of economic activity and contributes more than half of all domestic tax collections. In this respect, the introduction of the Gauteng Freeway Improvement Project (GFIP) is a welcome and needed investment. However, in order to ensure that the GFIP adds - and does not subtract - value to the economy, it is crucial that the structure and level of the proposed toll fees make economic sense.
The GFIP is not only one of the biggest construction projects ever undertaken in South Africa, it is also one of the most expensive. The cost of repayment will impact on the cost of living and doing business in Gauteng for years to come. However, despite the importance of the project and associated toll fees to the regional economy, very little data has been provided to the public as to how the level of the toll fees had been calculated. Toll levels have essentially been presented as a fait accompli, which causes deep concern, given that Sanral does not answer to any form of price regulation processes.
Using information in the public domain and applying conservative methodology, this study interrogated the data provided by Sanral in order to provide an assessment of its robustness and whether or not it seems to make economic sense. From this analysis it is clear that there are many unanswered questions as to the structure and level of GFIP toll fees which need to be addressed before proceeding with implementation.
This study provides an initial assessment of the costs of the GFIP for the road freight industry, the South African commuter, and the Gauteng consumer. Specific questions addressed include the likely incidence of toll fee collections from business and private commuters, the price impact on consumer goods (and whether wealthy or poor consumers are more likely to be affected), and whether construction costs are in line with international practice.
2. Transportation and the Gauteng economy
The GFIP initiative and the decision to toll the roads will have a material impact on the Gauteng economy. The size of the impact depends on the importance of the GFIP roads to the Gauteng transportation network, and the share of road transportation in the regional economy. We therefore begin by examining these relationships.
Although data on the share of each transport mode on a provincial basis is not freely available in the public domain, a rough estimate of Gauteng's transport mode share can be derived by excluding sea transport and auxiliary transport activities from the national breakdown. As shown in Table 1 below, road freight transport is estimated to be the second largest transport mode in Gauteng, with a share of approximately 32.4% in the total transport sector. Other transport sectors may also be influenced by the GFIP as much of the air freight traffic will also be affected by the establishment of toll on the GFIP highways. The same would apply to rail transport, as in most cases the goods will travel the last part of their journey by road.
Table 1: Share of different transport modes in Gauteng
|
Gauteng share of transport modes by income |
Estimated share |
|
Rail |
19.1% |
|
All land passengers |
8.6% |
|
Road freight |
32.4% |
|
Pipeline |
1.3% |
|
Air |
38.6% |
|
Total |
100% |
Source: Economists.co.za estimate from large transport survey from Statistics South Africa; excludes all auxiliary transport activity such as storage and handling.
These income shares can be used to derive an estimate of the importance of the Gauteng road freight sector to both the provincial and national GDP, as shown in Table 2 below. Gauteng road freight comprises only 0.6% of South African gross domestic product. However, Gauteng road freight makes up around about 1.8% of Gauteng's GDP (and Gauteng in turn contributes nearly 35% of South African GDP).
Table 2: Gauteng road freight as a % of South Africa and Gauteng GDP
|
2005 |
2006 |
2007 |
2008 |
2009 |
|
|
Gauteng road freight as a % of South African GDP |
0.6% |
0.6% |
0.5% |
0.6% |
0.6% |
|
Gauteng road freight as a % of Gauteng GDP |
1.6% |
1.6% |
1.6% |
1.8% |
1.8% |
Source: Economists.co.za.
The importance of the road freight sector is to some extent understated by its provincial GDP share. Road transportation is not only an end product, but is also an important input into many production processes. As such, efficiency in the Gauteng road transportation sector leverages efficiency and growth in the rest of the provincial economy. Gauteng remains the commercial hub of the country and the SADC region, and a negative impact on the Gauteng economy will have negative impacts on South Africa and even SADC.
2.1 Fairness and the user-pays principle
South Africa has committed to a principle of user-pays in infrastructure financing. If implemented correctly, this principle both increases economic efficiency and conforms with a general understanding of fair play, as those who benefit most from the infrastructure are those that pay for it. However, several aspects of the current toll scheme distort these objectives.
As the wealthiest province in the country, Gauteng currently is responsible for more than 50% of all personal taxes, despite containing only about 20% of the population. It is by far the biggest provincial contributor to the fiscus, and much of this contribution is currently redistributed to other provinces.
Most of the current transport infrastructure in Gauteng comprises municipal roads. As municipal and provincial roads are maintained and built by local and provincial governments, residents thus pay for these roads via contributions to these governments. Whereas national roads comprise 9% to 15% of roads in other provinces, in Gauteng they account for less than 7% of the total amount of roads. Sanral only maintains national roads and therefore has the least amount of road to maintain in Gauteng, compared to all of the other provinces in the country.
Table 3: Provincial breakdown - road infrastructure by category, kilometres
|
Province |
Municipal roads |
National & numbered roads |
Prov. & rural roads |
Total |
National roads as % of total |
|
Gauteng |
40 917 |
3 759 |
10 333 |
55 009 |
6.8% |
|
KwaZulu-Natal |
33 237 |
9 938 |
54 734 |
97 909 |
10.2% |
|
Western Cape |
31 830 |
10 293 |
50 057 |
92 180 |
11.2% |
|
Eastern Cape |
10 124 |
10 505 |
57 855 |
78 485 |
13.4% |
|
Free State |
11 484 |
9 836 |
90 033 |
111 353 |
8.8% |
|
Mpumalanga |
11 471 |
8 444 |
36 110 |
56 025 |
15.1% |
|
North West |
10 920 |
9 137 |
52 556 |
72 613 |
12.6% |
|
Limpopo |
10 401 |
7 936 |
48 066 |
66 403 |
12.0% |
|
Northern Cape |
9 145 |
12 173 |
89 877 |
111 195 |
10.9% |
|
RSA |
169 530 |
82 019 |
489 623 |
741 172 |
11.1% |
Source: RTMC 2008.
Although only 4.5% of the total stock of national roads are in Gauteng, revenue forecasts suggests that Sanral will receive the bulk of its income from Gauteng. Sanral's 2010 annual report shows the total current income from toll roads to be R3.7 billion. In contrast, Sanral estimates its total toll income from the GFIP at R3.6 billion. In other words, the GFIP will make a disproportionately large contribution to Sanral's income.
We estimate Gauteng to make a contribution of 58% to 62% to Sanral's income in calendar year 2012, due to both the levels of congestion in Gauteng and the high cost of GFIP toll fees. At the growth rates shown in Table 4, it is likely that Gauteng now has over 600 vehicles per 10 km of road, making Gauteng's roads by far the most congested in the country (at least four times the amount of the next busiest province, namely the Western Cape).
Table 4: Number of registered motorised vehicles per 10 km road length per province
|
Province |
GA |
KZ |
WC |
EC |
FS |
MP |
NW |
LI |
NC |
RSA |
|
|
||||||||||
|
2000 |
413 |
90 |
114 |
53 |
34 |
63 |
46 |
39 |
12 |
82 |
|
2001 |
422 |
90 |
116 |
54 |
33 |
64 |
47 |
40 |
12 |
83 |
|
2002 |
429 |
91 |
117 |
55 |
33 |
65 |
48 |
41 |
12 |
84 |
|
2003 |
443 |
93 |
120 |
56 |
34 |
66 |
50 |
43 |
12 |
87 |
|
2004 |
461 |
97 |
125 |
59 |
34 |
70 |
51 |
45 |
12 |
90 |
|
2005 |
495 |
103 |
133 |
63 |
36 |
75 |
54 |
48 |
13 |
96 |
|
2006 |
534 |
111 |
142 |
67 |
37 |
80 |
58 |
53 |
14 |
103 |
|
2007 |
570 |
118 |
149 |
71 |
39 |
85 |
61 |
57 |
15 |
110 |
|
2008 |
585 |
120 |
153 |
73 |
40 |
89 |
63 |
60 |
16 |
113 |
Source: RMTC.
The numbers illustrate that, for the current Gauteng taxpayer, road infrastructure is clearly not provided on a user-pays basis. Despite contributing the bulk of personal and income tax collections, Gauteng has a relatively small road infrastructure. The introduction of GFIP tolls will exacerbate this status quo by increasing the proportion of Sanral's income derived from Gauteng. Far from being in accordance with a user-pays principle, this is tantamount to an increase in redistributive "taxation".
2.2 Excessive construction costs
Although limited detail is available about the manner in which Sanral has determined the proposed toll fees, it is clear that the level of the toll fees had been affected by the road construction costs. High construction costs, if not countered by among others appropriate funding and financing models, will therefore put excessive upward pressure on the level of toll fees. It is thus a cause for great concern that, when compared to the international costs of highway construction, the per kilometre expenditure of the GFIP seems extremely high.
Two data sources were used to make international comparisons. The first dataset is highway projects recently financed by the World Bank, for which data is presented in Table 5. Many of these projects are green fields (new, opposed to upgrade) highway construction projects in countries with per capita GDP levels much lower than that of South Africa. Both factors tend to decrease comparability with the GFIP. Nevertheless, the extent to which South African costs exceed the comparative numbers, is striking. On a per kilometre basis, the GFIP costs 228% more than the World Bank funded projects (it should be noted that, for the sample shown, road upgrade projects were in fact slightly cheaper than green fields projects).
Table 5: Road construction costs - recent World Bank financed projects
|
Project |
Description |
Country |
Year completed |
Total cost, US$ million |
Road length, km |
Implied cost per km, US$ million |
|
Dakar-Diamniadio toll road |
Green fields toll highway |
Senegal |
Underway |
531.38 |
128.0 |
4.15 |
|
Tongling-Tangkou Highway (Second Anhui Highway) |
Greenfields highway |
China |
2009 |
579.82 |
116.0 |
5.00 |
|
Ruijin-Anzhou Expressway (Jiangxi III Highway) |
Greenfields highway |
China |
2010 |
644.73 |
117.0 |
5.51 |
|
Allahabad Bypass |
Greenfields four lane toll highway, including 1km bridge |
India |
2009 |
340.55 |
84.7 |
4.02 |
|
Baku-Shamakhi highway upgrade (third highway) |
Upgrading road into four lane highway |
Azerbaijan |
Underway |
302.00 |
100.0 |
3.02 |
|
Shiyan-Manchuangan Expressway (Hubei Shiman Highway) |
Greenfields four lane highway |
China |
2009 |
675.76 |
105.0 |
6.44 |
|
Serbia Corridor X project |
Greenfields four lane highway |
Serbia |
Underway |
424.27 |
40.8 |
10.40 |
|
Xiaogan-Xiangfan Expressway |
Greenfields four lane highway |
China |
2007 |
820.47 |
243.5 |
3.37 |
|
Third East-West Highway improvement |
Upgrading road into four lane highway |
Georgia |
Underway |
184.10 |
15.0 |
12.27 |
|
Second East-West Highway improvement |
Upgrading road into four lane highway |
Georgia |
Underway |
80.00 |
24.0 |
3.33 |
|
Total |
4 583.07 |
974.00 |
4.71 |
|||
|
Total - highway upgrades only |
566.10 |
139.00 |
4.07 |
|||
|
Gauteng Freeway Improvement Project |
Upgrading six lane to eight lane highway |
South Africa |
Underway |
2 857.14[1] |
185.00 |
15.44 |
Source: World Bank project documents.
The second data source used is the Washington State Department of Transport (WSDOT) in the United States. WSDOT compiled a database of US highway construction costs.
The United States is a much wealthier nation compared to South Africa, which should tend to increase its labour and land costs in construction. Land prices and construction cost levels would be expected to be higher in a developed country than in an emerging market such as South Africa. However, of the GFIP comparable projects outlined by the WSDOT, per kilometre construction costs averaged US$6.59 million in 2004 (or US$7.49 million in 2009 terms). The GFIP's estimated costs are 106% higher.
Table 6: United States highway construction costs, 2004
|
Project |
Description |
State |
Year completed |
Total cost, 2004 US$ million |
Road length, km |
Cost per km, 2004 US$ million |
|
Route 123 Widening |
Widen two lane to four lane |
Virginia |
Post 2005 |
14.60 |
3.06 |
4.77 |
|
Interstate 4 Reconstruction |
Widen four lane to six lane, interchange modification |
Florida |
2002 |
82.70 |
8.21 |
10.08 |
|
SC 170 Widening |
Widen two lane to four lane and the replacement of two bridges |
South Carolina |
Post 2005 |
105.00 |
19.15 |
5.48 |
|
US 12 |
Widen two lane to four lane |
Washington |
Post 2005 |
50.80 |
19.31 |
2.63 |
|
I-90 |
Widen four lane to six lane |
Washington |
Post 2005 |
35.60 |
8.53 |
4.17 |
|
SR 270/Pullman to Idaho St Line |
Widen two lane to four lane |
Washington |
Post 2005 |
30.60 |
8.05 |
3.80 |
|
I-5 Maytown to 93rd Ave |
Widen four lane to six lane |
Washington |
2002 |
11.20 |
3.22 |
3.48 |
|
State Route 525 Widening |
Widen two lane to four lane |
Washington |
Post 2005 |
91.30 |
9.66 |
9.46 |
|
SR 202-SR 520 to Sahalee Way |
Widen two lane to four lane - portion of the road to be raised 14 feet to accommodate landslide |
Washington |
Post 2005 |
63.2 |
4.51 |
14.03 |
|
SR 18 - Maple Valley to Issaquah Hobart Road |
Widen two lane to four lane |
Washington |
Post 2005 |
97.9 |
4.83 |
20.28 |
Source: WSDOT 2005.
Many factors influence the construction cost of a given highway project, which means that some caution should be taken in interpreting cost comparisons. However, the size of the difference in price is too large to leave questions in this regard unanswered. Indeed, if the costs of the GFIP are inflated excessively, due to inefficiencies or other factors during the commissioning and construction processes, it will be inappropriate for Sanral to simply transfer the excess costs to the commuter and commercial road freight industry.
There is a clear need for a neutral party to investigate the Sanral figures in order to determine whether construction costs are excessive. As most of the project only involved the building of a single additional lane in each direction, there must be concerns about the high cost of the GFIP compared to other countries - even compared to (higher) First World building costs. Given that the sector has no price regulator, the potential for excessive construction costs is a real threat and possibility.
2.3 Capital repayment schedule
Sanral has stated that it expects its toll revenue to be R300 million per month. Our own estimates are set out below. We start by establishing an average vehicle toll cost, as shown in Table 7 below. As can be seen, even after generous assumptions for e-tag discounts, regular usage discounts as well as public transport discounts, the average per kilometre vehicle income for Sanral should be around 55 cents.
Table 7: Average per vehicle, per kilometre toll costs
|
Type of vehicle |
Actual discounted fee |
Share of revenue |
Category share |
|
Motorcars |
0.40 |
51.0% |
0.20 |
|
Minibuses |
0.16 |
2.1% |
0.00 |
|
Buses |
0.74 |
1.2% |
0.01 |
|
Motorcycles |
0.24 |
0.8% |
0.00 |
|
LDVs (bakkies) |
0.37 |
21.9% |
0.08 |
|
Trucks |
1.11 |
23.0% |
0.26 |
|
Per vehicle kilometre cost |
0.55 |
Source: Economists.co.za & DNA economics.
Note the following assumptions:
- 80% of drivers have an e-tag
- all buses & taxis qualify for public transport discount
- average cumulative discount for commercial bakkies and trucks is 37.5%
- average cumulative discount for cars and motorcycles is 15%
- average time of day discount is 5%
-only half of bakkie kilometres travelled are commercial
-Commercial trucks and bakkies spend 33% more time on the highway than average motor car.
This estimate can then be combined with estimates of total traffic volumes to derive toll revenue estimates. Traffic volume projections used in a study on the Gautrain project suggest that, as a daily average, 184 682 vehicles will travel between Pretoria and Johannesburg in 2011.[2] If traffic volumes achieved on this 50 km stretch are similar to those achieved on the rest of the GFIP network, and depending on estimates of the average distance travelled by each vehicle, an analysis of the fairness of a R300 million monthly toll revenue estimate can be made.
A high end/low end estimate is shown in Table 8 below. As can be seen, if even the average trip length is only 15km (i.e. 30 kms travelled on a round trip), and if the rest of the network achieves only 80% of the traffic on the Pretoria-Johannesburg route, average monthly revenues of R293 million are achieved. With some relaxation of these assumptions, revenue estimates quickly exceed R500 million per month. Sanral revenue estimates of R300 million per month thus seem fairly conservative, even if collection losses due to problems with the licensing system, for example, are quite high.
Table 8: Toll revenue high end/low end estimates
|
Low end |
High end |
|
|
Total GFIP average daily traffic |
583 595 |
683 323 |
|
Cost per km (R) |
0.55 |
0.55 |
|
Average distance travelled (km) |
30 |
50 |
|
Daily revenue |
R 9 629 319 |
R 18 791 394 |
|
Monthly revenue |
R 292 891 801 |
R 571 571 552 |
Source: Research team calculations, Environmental Impact Assessment: Proposed Gautrain Rapid Rail Link, Chapter 8.
Assumptions:
- Low end: traffic on the rest of the GFIP is only 80% of the volumes achieved on the 50kms from Pretoria to Johannesburg; average trip distance is 30km.
- High end: traffic on the rest of the GFIP is equivalent to the volumes achieved on the 50kms from Pretoria to Johannesburg; average trip distance is 50km.
We therefore conclude that the Sanral estimates of an income of R300 million per month seem realistic and collectable. We now examine the implications of this rate of toll collections for the repayment period of the loan (financing model).
If Sanral is planning to operate the GFIP toll system as a ring-fenced cost recovery system, then toll fees should be set at a level sufficient to cover the costs of construction and maintenance of the road over the loan period. Using publicly available data about the cost of the project and the medium-term note program, it is possible to test whether this is in fact the case.
The following data is available to test this hypothesis:
- Sanral has stated that the cost of the GFIP is R20 billion[3] and that estimated monthly income is R300 million.
- The term of the loan is 20 years.
- The rate that Sanral is currently paying on loans issued to date is in the region of 10% (as per the Sanral 2010 annual report).
- The cost of maintenance and repairs on the current Sanral road system is in the region of 1.2% of asset value (Sanral 2010 annual report).
Table 9 shows the implications of this data for a number of repayment scenarios:
- The first column shows the monthly amount needed to repay a R20 billion loan over 20 years. At R193 million, it is substantially less than Sanral's projected income level.
- The only way that monthly repayments of R300 million could extend for 20 years, would be if the interest rate increased to 17%, which is substantially above current levels.
- At a 10% interest rate and R300 million monthly payments, it would in fact take only 8.2 years to repay the loan.
- Finally, if we assume a generous maintenance allowance of 3% of asset value, repayments would reduce to R250 million per month, and the loan would still be repaid in only 11.1 years.[4]
Moreover, other studies such as the Gautrain Study estimate the growth of highway traffic in the province at 5% per year. Other than the 2008 decline, car sales in the province have averaged well over 10% per year in the last decade. This shows that provision for a 2% increase in GFIP traffic flows is very conservative. A larger traffic flow is thus very possible and as such will ensure more revenue for Sanral than the projected R300 million per month.
Furthermore, price increases may ensure even more revenue. When analysing consumer price inflation, administered prices (the category which will contain toll fee increases) have generally increased well above the inflation rate over the last 12 years. So, assuming an annual increase of 5% in toll fees will not be inappropriate. In fact, it is on the low side, as administered prices have registered average increases in the region of 8.5% per year over the last decade. In addition, South Africans tend to travel by motor car and this trend is unlikely to stop, even with huge price increases in toll fees. The consequence is that if they have to spend more on toll fees, consumers will cut their spending on other products and services.
Another aspect here is the cost of capital, which according to Sanral is around 10% (the weighted cost of capital for Sanral was 9,89% in the SANRAL annual report of 2010). Currently some of the highway bonds are closer to 9% in yield. As Sanral has stated the cost of the project is R20 billion, the actual repayments should be closer to R193 million a month, which indicates that the R300 million a month that Sanral expects in toll fees is rather excessive.
A factor that also needs to be taken into account is government guarantees for Sanral freeway projects, which would lower the cost of capital (it would reduce the perceived risk for investors). Sanral itself says that older projects did not have government guarantees and the new Hway bonds do have a government guarantee which is likely to reduce the weighted cost of capital over time.
Table 9: Repayment terms and interest rate under various assumptions
|
Actual repayments needed |
Possible repayment schedule - implied interest rate |
Repayment term if full collections used |
Repayment term if full collections used, less 3% maintenance costs |
|
|
Loan amount (million) |
R 20 000 |
R 20 000 |
R 20 000 |
R 20 000 |
|
Monthly Payment amount (million) |
R 193 |
R 300 |
R 300 |
R 250 |
|
Payment period (years) |
20 |
20 |
8.2 |
11.1 |
|
Interest rate (annual) |
10% |
17% |
10% |
10% |
Source: Research team calculations some of the actual calculations are in an appendix.
Accordingly:
- Revenue of R300 million per month will ensure that a loan of R31 billion rather than the R20 billion can be repaid.
- The GFIP tolls will allow Sanral to collect money over and above what is needed to finance the GFIP loans, which opens the door to cross-subsidisation of other sections of the Sanral road network.
- Far from being a "user-pays principle" in action, the GFIP will be another example of taxation of the Gauteng economic heartland to finance the rest of the country. It is quite clear that the tariffs in the case of the GFIP are currently excessive - even with the discount structure which is also not set in law and can thus be easily changed.
- Table 9 excludes any increases in tariffs over the next twenty years which would allow Sanral to pay off the loans even faster.
- All of the above information is publicly available information from Sanral itself and the research team has only applied economic calculation to Sanral's own estimates. The figures indicated above are therefore not normal assumptions, but actual "givens" from Sanral.
(If the weighted cost of capital were to be reduced to 9%, then the payback period may be even further reduced.)
3. Estimated toll revenue burden by type of road vehicle
Sanral estimates that the total annual collections of the GFIP will be in the region of R3.6 billion, or R300 million per month. In order to calculate which road users will bear the cost of this revenue collection, we have used data from the Road Traffic Management Corporation, which estimates the distance travelled in Gauteng by type of vehicle. Assuming that these travel patterns are fairly characteristic of the GFIP roads as well, and then by applying weights according to the different GFIP toll fee levels for different vehicle classes as announced by Sanral, estimates can be derived of how the burden of toll fees will be distributed.
As shown in Table 10 below, more than 60% of the total kilometres travelled in Gauteng annually are attributable to cars, with trucks making up 7% of kilometres travelled. However, the GFIP roads are likely to experience a slightly higher proportion of commercial trips, as commercial vehicles spend less time on rural and suburban roads. In order to reflect this, an assumption is made that truck and LDV/bakkie mileage on the GFIP roads are 33% and 16% higher than on Gauteng roads as a whole.
This has the effect of decreasing kilometres attributable to cars to 57% and increasing truck travel to 9% of the total.
Table 10: Distance travelled by type of vehicle, in millions of km
|
Share of type of vehicle |
Total annual distance travelled (actual) in millions of KM |
% of distance travelled, Gauteng as a whole |
% of distance travelled, GFIP only* |
|
Motorcars |
2 191.77 |
61% |
57% |
|
Minibuses |
218.85 |
6% |
6% |
|
Buses |
28.44 |
1% |
1% |
|
Motorcycles |
53.5 |
1% |
1% |
|
LDVs (bakkies) |
865.27 |
24% |
26% |
|
Trucks |
263.88 |
7% |
9% |
|
Totals |
3 621.72 |
100% |
100% |
Source: RTMC, Economists.co.za assumptions for GFIP distance travelled.
* GFIP numbers adjusted to reflect a 33% proportional increase in truck travel, and a 16% increase in LDV travel on actual toll roads.
These numbers can then be combined with announced Sanral toll price structures to gain an idea of the vehicle classes' toll burden. As shown in Table 11, although the undiscounted toll amount for motorcars, for example, is 66 cents, it is likely that the average driver will receive a discount in the region of 40% (the assumptions underlying this are shown below the table).
The highest effective discounts will go to providers of public transportation, while truck drivers will be more likely to be eligible for cumulative toll discounts. The net impact is that just over half of the total toll revenue is likely to be derived from motorcars, with trucks and LDVs/bakkies making up the majority of remaining revenue. Despite making up only about 9% of kilometres travelled on the GFIP, and a discount, commercial trucks are expected to contribute 23% of revenue. This is because trucks will pay a much higher toll charge even after discounts have been applied.
One of the problem areas in the assumptions we make is the fact that LDV's/bakkies are used both for commercial transport reasons and for personal travel. Moreover, in South Africa a number of smaller "informal" (if you wish) type of transporters make deliveries, primarily making use of "bakkies". To complicate things further, the LDV/bakkies are used by many small businesses outside of the commercial transport arena, but there is some understanding that one can assume around half of the LDV's/bakkies to be of a commercial nature or at least when they travel on the GFIP. If half of LDV/bakkie travel is assumed to be for freight purposes, then 33.7% of toll fees will be acquired from the freight industry. This is obtained from Table 11 below, where the overall share of toll revenue have been obtained.
The 33.7% that the commercial road freight industry will contribute of the R300 million per month estimated income will make up around R100 million per month. This means that over a period of a year, the actual toll costs for the road freight industry will be around R1,2 billion.
Table 11: Weighted, discount-adjusted toll revenue share by type of vehicle
|
Share of type of vehicle |
Full toll fee |
Discount factor |
Actual fee |
Share of toll revenue |
|
Motorcars |
R 0.66 |
40% |
R 0.40 |
51.0% |
|
Minibuses |
R 0.66 |
75% |
R 0.16 |
2.1% |
|
Buses |
R 2.97 |
75% |
R 0.74 |
1.2% |
|
Motorcycles |
R 0.40 |
40% |
R 0.24 |
0.8% |
|
LDVs (bakkies) |
R 0.66 |
44% |
R 0.37 |
21.9% |
|
Trucks |
R 2.97 |
63% |
R 1.11 |
23.0% |
Source: DNA Economics and Economists.co.za.
Assumptions:
- 80% of drivers have an e-tag.
- all buses & taxis qualify for public transport discount.
- average cumulative discount for commercial bakkies and trucks is 37.5%.
- average cumulative discount for cars and motorcycles is 15%.
- average time of day discount is 5%.
- only half of bakkie kilometres travelled are for commercial purposes.
Truck toll fees are the average of Class B and Class C as per Sanral rate card.
4. Impact on cost of living
The GFIP will have an impact on the cost of living via two mechanisms: the direct increase in the cost of travel for those who travel via the GFIP; and an indirect increase in the transportation costs component of all goods and services, which will impact on all consumers. Gauteng commuters and consumers will be impacted most by these mechanisms, but the impact will also spread to the national economy. Some initial estimates as to the size and severity of these impacts are provided below.
As has been shown, it seems probable that approximately one third of the cost of the GFIP toll system will fall to the commercial freight sector. Sanral estimates that total toll revenue will be in the region of R300 million per month, or about R3.6 billion per year, which implies that about R100 million will be collected from the commercial road freight industry per month, with the remaining R200 million per month (R2.4bn annually) collected from ordinary road users.
Government expects to collect R252 billion in personal taxes this fiscal year, of which roughly half (R126 billion) will be collected in Gauteng. The total expected annual toll revenue on Gauteng commuters therefore is equivalent to roughly a 2% increase in the personal tax rate (R2.4 billion as % of R126 billion), or a 1% increase in the tax rate for the country as a whole.
The remaining R1.2 billion in GFIP toll revenues, which will be acquired from the freight sector, is equivalent to approximately 10% of all company taxes collected from the total transport and communication and storage sector (2008 numbers). However, road freight comprises only a small part of the total transport, communication and storage activity. Thus, the GFIP will ensure that the road freight sector will pay a disproportionately larger amount of tax. For example, if road freight comprises only around a third of tax collections in the sector, then the impact of the GFIP tolls is to increase the effective rate of taxation on the sector by 30%, which raises concerns as to the future health of the commercial road freight industry.
The commercial road freight industry will in all likelihood have no choice but to pass on the actual costs of the tolls to their clients, who themselves are likely to pass on these costs to their clients. At the end of the day all goods transported by road via the GFIP will have a level of cost increase that the consumer will have to bear the brunt of.
4.2 Impact on price of end products
The GFIP toll scheme will have an impact on the size of transportation costs in the Gauteng logistics chain, and thus as costs feed through to the end consumer, on the end price of goods and services. Some idea of the size of this impact can be derived by examining data from the Land Transport Survey. This survey provides data on a national basis, but the size of the Gauteng road freight sector can be proxied by assuming that Gauteng comprises 32% of the national total - which is the slightly smaller than the proportion which the Gauteng provincial GDP contributes to the national GDP.
Table 12 below uses the estimated incidence of tolls on the freight industry, and estimated Gauteng road freight income, to derive an estimate of the total cost effect of the tolls on the formal road freight industry in Gauteng. As shown, using 2010 figures, a monthly toll fee of R100 million is equivalent to a 7.1% increase in the total cost of road freight in Gauteng.
Table 12: Gauteng road freight income and commercial freight estimated toll fees
|
Month |
Gauteng road freight income (Rm) |
Road freight toll fees payable (Rm) |
Gauteng toll fees as % of Gauteng road freight income |
|
|
Jan-10 |
1 248.32 |
100 |
8.0% |
|
|
Feb-10 |
1 312.96 |
100 |
7.6% |
|
|
Mar-10 |
1 417.28 |
100 |
7.1% |
|
|
Apr-10 |
1 300.48 |
100 |
7.7% |
|
|
May-10 |
1 393.6 |
100 |
7.2% |
|
|
Jun-10 |
1 440 |
100 |
6.9% |
|
|
Jul-10 |
1 475.52 |
100 |
6.8% |
|
|
Aug-10 |
1 453.76 |
100 |
6.9% |
|
|
Sep-10 |
1 426.56 |
100 |
7.0% |
|
|
Oct-10 |
1 477.12 |
100 |
6.8% |
|
|
Nov-10 |
1 512 |
100 |
6.6% |
|
|
Dec-10 |
1 368.96 |
100 |
7.3% |
|
|
Total for 2010 |
16 826.56 |
1 200 |
7.1% |
Source: Basic data from Statistics SA road freight data and Gauteng values derived, assuming that road freight in Gauteng makes up 32% of total transport as it does in the national GDP numbers.
This relatively high number is supported by data provided by road freight companies themselves. Table 13 sets out estimates of the cost increase imposed by the GFIP, as supplied by the road freight companies themselves to the research team.[5] The twenty-four companies which provided data have a total freight fleet of approximately 7 400 vehicles. Widely differing cost impacts are expected, depending on the region in which they operate, the main routes they use, and (to some extent) the commodities transported. A simple arithmetic average, however, suggests that the cost increase may be in the order of 4.86%.
Table 13: Survey of impact of GFIP tolls on road freight companies
|
Trucker survey |
Average increase |
Able to rearrange operations? |
Regional notes |
Costs or revenue? |
|
|
Transporter 1 |
6.40% |
no |
Gauteng based |
Operational costs |
|
|
Transporter 2 |
3.50% |
no |
Gauteng based |
n.a. |
|
|
Transporter 3 |
2% |
no |
Countrywide |
n.a. |
|
|
Transporter 4 |
7% |
no |
Gauteng |
Operating costs |
|
|
Transporter 5 |
0.38% |
no |
Southern Cape based |
n.a. |
|
|
Transporter 6 |
0.90% |
no |
Countrywide |
Overall costs |
|
|
Transporter 7 |
9.16% |
no |
Gauteng only |
Operating costs |
|
|
Transporter 8 |
5% |
no |
Countrywide |
n.a. |
|
|
Transporter 9 |
20% |
no |
Gauteng only |
As % of costs |
|
|
Transporter 10 |
0.50% |
no |
Countrywide |
As % of total revenue |
|
|
Transporter 11 |
10% |
no |
Gauteng mainly |
As % of total costs |
|
|
Transporter 12 |
1.90% |
no |
Countrywide |
As % of revenue |
|
|
Transporter 13 |
1.20% |
no |
Countrywide |
As % of revenue |
|
|
Transporter 14 |
3% |
no |
Gauteng based |
As % of revenue |
|
|
Transporter 15 |
2.50% |
no |
Countrywide but Gauteng based |
As % of revenue |
|
|
Transporter 16 |
5.50% |
no |
Gauteng based |
As % of revenue |
|
|
Transporter 17 |
5% |
? |
Gauteng based |
As % of revenue |
|
|
Transporter 18 |
6% |
no |
Gauteng based |
As % of overall costs |
|
|
Transporter 19 |
8% |
? |
Gauteng based |
As % of costs |
|
|
Transporter 20 |
3.6% |
no |
SADC wide but Gauteng based |
As % of total costs |
|
|
Transporter 21 |
7.50% |
? |
Gauteng only |
As % of total costs |
|
|
Transporter 22 |
2.60% |
no |
Countrywide |
As % of costs |
|
|
Transporter 23 |
4% |
no |
Gauteng based but countrywide |
As % of costs |
|
|
Transporter 24 |
1.10% |
? |
Countrywide |
As % of revenue |
|
|
Overall |
4.86% |
no |
Mixed |
Source: RFA survey plus Economists.co.za survey.
Note that these transport companies represent at least 7 400 vehicles.
More detail can be provided by examining Gauteng-based and non-Gauteng based companies separately, as is done in Tables 14 and 15 below. For companies which are based in Gauteng, and thus more likely to use GFIP roads, the average expected cost increase is 6.74% - which is also similar to the provincial toll cost estimate of 7.1% derived in Table 12. For those with a countrywide footprint, cost increases are expected to be around 1.90%. If the estimate in Table 12 is repeated using national data instead of provincial data, a national cost estimate of 2.3% is generated, which confirms this estimation technique).
Table 14: Gauteng based freight operators - GFIP toll impact
|
Trucker survey |
Average increase |
Able to rearrange operations |
Regional notes |
|
|
Transporter 1 |
6.40% |
No |
Gauteng based |
|
|
Transporter 2 |
3.50% |
No |
Gauteng based |
|
|
Transporter 4 |
7% |
No |
Gauteng |
|
|
Transporter 7 |
9.16% |
no |
Gauteng only |
|
|
Transporter 9 |
20% |
no |
Gauteng only |
|
|
Transporter 11 |
10% |
no |
Gauteng mainly |
|
|
Transporter 14 |
3% |
no |
Gauteng based |
|
|
Transporter 15 |
2.50% |
no |
Country wide but Gauteng based |
|
|
Transporter 16 |
5.50% |
no |
Gauteng based |
|
|
Transporter 17 |
5% |
? |
Gauteng based |
|
|
Transporter 18 |
6% |
no |
Gauteng based |
|
|
Transporter 19 |
8% |
? |
Gauteng based |
|
|
Transporter 20 |
3.6% |
no |
SADC wide but Gauteng based |
|
|
Transporter 21 |
7.50% |
? |
Gauteng only |
|
|
Transporter 23 |
4% |
no |
Gauteng based but country wide |
|
|
Overall |
6.74% |
no |
Mixed |
Source: RFA survey plus economists.co.za survey.
Some transport firms, however, are likely to experience very big cost increases, especially those who are based in areas adjacent to the GFIP, such as Midrand, Olifantsfontein, Jet Park, Boksburg and Isando. These areas have historically been attractive for freight companies, as they are centrally situated and close to many prospective clients. The overwhelming majority of transport firms state that it would be difficult to re-arrange their operations to avoid GFIP toll charges.
Table 15: Countrywide freight operators - GFIP toll impact
|
Countrywide transport operations toll price cost effect. |
||||
|
Trucker survey |
Average increase |
Able to rearrange operations? |
Regional notes |
|
|
Transporter 3 |
2% |
no |
Countrywide |
|
|
Transporter 6 |
0.90% |
no |
Countrywide |
|
|
Transporter 8 |
5% |
no |
Countrywide |
|
|
Transporter 10 |
0.50% |
no |
Countrywide |
|
|
Transporter 12 |
1.90% |
no |
Countrywide |
|
|
Transporter 13 |
1.20% |
no |
Countrywide |
|
|
Transporter 22 |
2.60% |
no |
Countrywide |
|
|
Transporter 24 |
1.10% |
? |
Countrywide |
|
|
Overall average |
1.90% |
no |
Countrywide |
|
Source: RFA survey plus economists.co.za survey.
In theory, road freight companies may be able to reduce their tolling costs by travelling at non-peak periods. In practice however, they have limited ability to work outside of normal office hours. Many retailers and manufacturers refuse to take or send deliveries beyond normal business hours, as doing so would require the hiring of additional staff, or overtime payment. Furthermore, customers of higher value items perceive that they may be at greater risk if deliveries occur beyond normal operating hours. Road freight companies who try to shift trips outside of office hours, will thus face additional labour costs. This will reduce the toll fee discount benefit. They are currently using their fleet at almost maximum capacity, which will reduce their ability to schedule changing or provide for additional trips.
One of the largest nationwide transporters has indicated that the GFIP toll scheme will increase their total costs by R87 million a year. Another smaller transporter indicated that their costs are expected to increase by R1.25 million annually, on a total turnover of R20 million. They indicated that, as a smaller operator, it will be difficult to pass on costs, and thus that the toll scheme will erode most of their profit margin. Statistics South Africa's Large Transport Industry Survey indicates that the road transport industry has a net profit margin of only 4.5%, which implies that the ability of the industry to absorb a 2% to 7% cost increase, is extremely limited. It is thus clear that the bulk of toll costs will be passed on to the consumer within a year, or that smaller operaters may be forced to close down.
4.3 Specific cost increases on selected products
In order to illustrate the ultimate impact on consumers of the GFIP toll scheme, we calculated the percentage price increase to be effected by toll fees on three key items in the typical consumer basket, namely a litre of milk, a litre of petrol, and a loaf of bread. The research is based on interviews with market participants and documented transportation costs by industry organisations.
Table 16: Consumer goods transport costs - prior to GFIP toll
|
Transport costs (cents) |
Notes: |
|
|
Litre of milk |
156 |
Three transport stages, all road. |
|
Litre of petrol |
29.9 |
Partly transported by pipeline (13 cents per litre cost), remainder via road. |
|
Loaf of bread 2007 |
193 |
2007 cost study by millers - 70% road then, now 80% road |
|
Loaf of bread (2010 est) |
241 |
Based on 80% road and transport price increase derived from land survey |
Sources: Actual transporter in milk and bread industry. SA Chamber of Millers/Bakers, CEF Media release on petrol.
Assuming that transport firms can pass all of their increasing costs to consumers - which we believe will be the case, given relatively low profit margins in the road freight industry - the following price increases could be experienced in each product:
Table 17: Consumer goods transport costs - increases caused by GFIP tolls
|
Price increase in Gauteng |
Transport price increase (cents) |
Transport price increase (%) |
|
|
Litre of milk |
6.2 |
4.0% |
Estimate for 4% increase. |
|
Litre of petrol |
1.1 |
3.7% |
Taking Gauteng distribution increase of 6,7%. |
|
Loaf of bread |
12.1 |
5.0% |
Estimate from industry of 5% increase in transport costs. |
Sources: Actual transporter in milk and bread industry. SA Chamber of Millers/Bakers, CEF group Media release on petrol. Also based on industry player telephonic interview on 29th of March 2011.
These transport price increases will feed into retail prices as shown in Table 18. For some items, the price impact is likely to be negligible - for example, the petrol price should increase by only 0.1%. The highest price increases will be on the cheapest kinds of bread, which is an important staple food for the poorest South African households. The GFIP tolls are estimated to add 2% to the cost of these items.
Table 18: GFIP toll impact on end product cost
|
Indicative product costs |
% impact of GFIP tolls |
|||
|
Product cost |
low |
high |
low |
high |
|
Litre of milk |
R 7.00 |
R 10.00 |
0.9% |
0.6% |
|
Litre of petrol |
R 9.27 |
R 9.42 |
0.1% |
0.1% |
|
Loaf of bread |
R 6.00 |
R 10.00 |
2.0% |
1.2% |
Source: Research team indicative price assessments. The GFIP will have a larger impact on lower priced goods as the table above shows. A small loaf of brown bread at around R6.00 will have a 2% increase, while a seed loaf which costs R10.00 will have an increase of 1,2%.
This is consistent with the high proportion of milling costs derived from distribution, as shown in Figure 1 below. In 2007, distribution accounted for 40% of the total cost of milling. The high weighting of transport costs in total costs is likely to be seen in other staple food products, such as maize meal, which are bulky and of low value. The impact on the cost of food is therefore likely to be largest in the simplest and cheapest foodstuffs. In turn, these foodstuffs comprise a proportionately larger part of poor households' consumption (compared to other income groups). Inflation weights based on spending patterns in 2008 indicate that, for the poorest 20% of South African households, more than 39% of the household budget is expended on food, whereas the richest 20% of South Africans spend only about 11% on food.
Figure 1: Contribution of cost items to total milling costs in South Africa
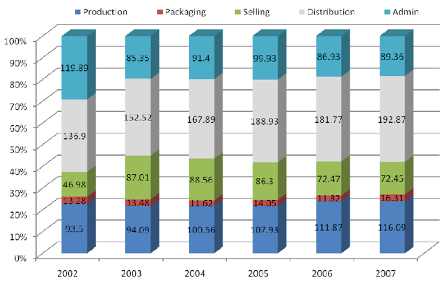
Source: National Chamber of Milling/Baking.
Note: Figures inside the bars are in cents.
Other items such as clothes and furniture are expected to experience inflation increases of less than 0.5% as a result of the GFIP tolls. Overall we expect the inflation rate in Gauteng to increase with about 0.4% as a result of the tolls, mainly as a result of the indirect impact on food prices, rather than the direct impact of toll payments on transport costs.
Table 19: CPI weights for food and non-alcoholic beverages
|
Weights |
Overall |
Very low income |
Low income |
Middle income |
High |
Very high income |
Pensioners |
|
Food and beverages |
15,68 |
39,96 |
35,80 |
32,84 |
24,95 |
10,25 |
19,87 |
Source: Statistics South Africa consumer price weights.
While the inflation impact may not be that big, combined with the lifestyle impact (as toll fees are not currently part of the actual inflation basket) will reduce the ability of Gauteng economy to grow, while probably also having an impact on the South African economy overall. While toll roads are one of the solutions to the need for more roads, the costs must also be reasonable as to make sure that the economic impact is not excessively negative.
Examination of the limited data actually in the public domain strongly suggests that the proposed GFIP tariff structure is excessive. High toll fees will have a negative impact on the Gauteng economy, and thus on the national economy.
Moreover, the impact of high toll fees will be felt disproportionately by poorer consumers. The toll fees will also impact basic products more such as bread and milk, than it will impact for example consumer electronics. The end consumer in effect is the one who pays all taxes and tariffs - even toll fees.
The high level of GFIP toll fees compared to the cost of other roads moreover suggest that major cross subsidisation is likely to take place between GFIP and other Sanral freeways. Many of the roads that Sanral manages are free of charge, whereas those in Gauteng are going to attract the highest toll fees the country has ever seen. GFIP toll fees urgently need to be independently reviewed, in order to ensure that they have indeed been set in accordance with the user-pays principle (rather than the user cross-subsidises principle), and that levels have been set so as to minimise economic damage.
This analysis strongly suggests that much lower GFIP toll fees are indeed possible and consistent with the need to finance Gauteng's economic infrastructure.
In addition, a cost benefit analysis (with data made available) will show whether the benefits of the GFIP will be eroded by the fee structure. A transport regulatory authority to oversee toll fee determination should also reduce monopolistic pricing - as contemplated by the proposed New Growth Path.
Additional time, money and effort expended on a process of independently reviewing toll fee determination would be well rewarded by achieving a more equitable and efficient toll structure than is currently the case.
Bibliography
Land Transport Survey, Statistic South Africa, various issues.
Gross Domestic Product, Statistics South Africa, November 2010 issue.
Consumer Price Index weight, Statistics South Africa, 2008.
Sanral Annual Report 2010.
World Bank project database.
Washington State Department of Transportation (WSDOT). 2005. Highway Construction Costs. Available from http://www.wsdot.wa.gov/biz/construction/CostIndex/pdf/HighwayConstructionCosts2005.pdf
Issued by AfriForum, April 5 2011
Click here to sign up to receive our free daily headline email newsletter
FOOTNOTES:
[1]. Assumes GFIP construction cost of R20bn (10 March 2011 correspondence between Sanral and AfriForum), at a R7/$ exchange rate.
[2]. Environmental Impact Assessment: Proposed Gautrain Rapid Rail Link, Chapter 8.
[3]. 10 March 2011 correspondence between Sanral and AfriForum.
[4]. It should be noted that the inclusion of revenue and cost escalation factors do not change the overall conclusion significantly. For example, if it is assumed that vehicle volumes grow by 2% annually and toll price inflation is 5% annually, which results in a 7% average annual increase in toll collections and maintenance costs, then the repayment term of the loan drops from 8.2 years to 7.9 years.
[5]. These estimates have not been independently verified by the research team.
