Land Centre of Excellence
LAND AUDIT: A TRANSACTIONS APPROACH
NOVEMBER 2017
Executive Summary
Policy formulation around the very sensitive and complex issue of land has been based on perception rather than fact for too long. No reliable figures on land ownership in South Africa exist. The partners in this initiative (ADS, Landbouweekblad and Agri SA) deem it of critical importance that a policy debate on sustainable land reform based on reliable data takes place We acknowledge that there are still some gaps in the data, however we wish to present statistics that might shed light on ownership patterns in South Africa. The focus of this study was on agricultural land.
Evaluating the ownership of agricultural land requires a multi-pronged approach. It is not merely a question of ownership in terms of land size (hectares), but rather a combination of land size, value, land potential and other factors. Comparing 1994 and 2016, it is evident that the amount of agricultural land has decreased from approximately 79.3% in 1994 to 76.3% in 2016. Accordingly, this forms part of the broader perspective with which the ownership of agricultural land should be evaluated. Furthermore, the value and potential of agricultural land form crucial components of a more holistic view of farm ownership.
When considering ownership by Previously Disadvantaged Individuals (PDIs), in terms of the land’s value and the land’s potential, the ownership share increased significantly. On a national level: in terms of value, the share is 29,1% and in terms of land potential, the share is 46,5%. These statistics compare favourably against an ownership share of only 14.9% in 1994 (based on land size in hectares). These results highlight the need to consider broader measures than the hectare land size alone. Considering these measures, provides a broader perspective on the progress with enhancing ownership by PDIs. Agri SA’s longer-term aim is to collaborate with ADS as well as key academic and government stakeholders to expand and update data on land ownership in South Africa.
Government has over time set targets for land reform. The Reconstruction and Development Programme (RDP) document for example set a target of 30% of land to be transferred to PDIs by 2014. The National Development Plan (NDP) set a target of 20% of commercial agricultural land per district to be transferred by 2030. The setting of targets has created expectations. At the same time, there was no way to measure whether these targets were being achieved as no comprehensive land audit was done.
To ensure effective and sustainable policy formulation, land policy should be based on a factual foundation. This land audit provides such a foundation.
As part of this report, Agri SA will develop a new, partnerships-based, solutions strategy to help solve the problems faced by land policy makers.
1. Introduction
The question of land ownership is often raised as part of the policy debate on land reform and rural development. The ownership of agricultural land is at the core of this debate. Although statistics on the racial make-up of land ownership are incomplete and limited, many argue that land reform has failed and that the ‘land market’ is the main reason for this failure. However, there is no clear evidence of such a market failure.
Unfortunately, in the absence of statistics, the policy debate has turned to ideas such as radical economic transformation, land ceilings and expropriation without compensation. These ideas are fuelled by the view that land reform and the land market have failed to deliver an acceptable level of land transfer to previously disadvantaged individuals and disadvantaged communities.
1.1 Background
Within this context, Agricultural Development Solutions (ADS) initiated a research project in collaboration with Landbouweekblad to compile a database of land ownership which reflects all transactions of more than ten hectares involving agricultural land. The database includes transactions from 1994 to 2016. The database can help to inform the policy debate by providing more complete statistics on the racial make-up of land ownership in South Africa.
Agri SA, as a representative organisation of commercial farmers in South Africa, regards the general availability of more complete and reliable data on land ownership as crucial to having a more informed public discourse. Agri SA entered into an agreement with ADS to obtain access to the ADS transactional data which it has gathered. The transactional data compiled by ADS, forms the basis of this report. The aim of this report is to provide a more detailed indication of the racial make-up of land ownership in South Africa.
As a starting point, before considering our land audit data, we need to consider South Africa’s broader geographic characteristics. The following figures provide an overview of South Africa, by considering:
1) Figure 1: A map of South Africa illustrating the pre-94 Tribal Authorities (“Former homelands”) and all National Parks;
2) Figure 2: Figure 1 with the addition of build-up areas;
3) Figure 3: A map of South Africa depicting agricultural potential with an overlay of the areas shown and described in Figures 1 & 2.
Please note, the below maps where compiled by the Bureau for Food and Agricultural Policy (BFAP). A variety of sources where used to compile these maps, these include: DAE (2017), DAFF (2016) and DWA (2006). These maps are not linked and do not form part of the land audit results discussed in the body of this report. These maps are intended to provide a broader background and context of land use in South Africa and are used for illustrative purposes.
Figure 1: Tribal Authorities and National Parks
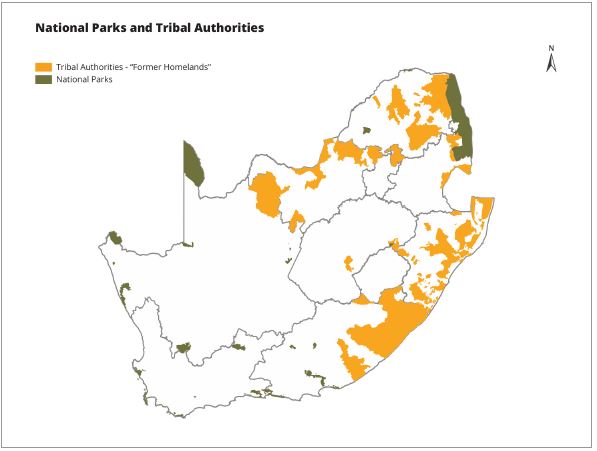
Source: Compiled by BFAP (2017) from: DAE (2017), DAFF (2016) and DWA (2006).
Figure 1 provides an overview of the, pre-1994, Tribal Authority areas, which were transferred to the Democratic Government in 1994.
On a macro level, land that fell under the Tribal Authority areas could either have been: retained by the Government, transferred to national parks, transferred to Previously Disadvantaged Individuals (PDIs), sold to individuals or organisations or transferred to municipalities. Furthermore, municipalities could have sold land to individuals or organisations. Figure 2 adds to Figure 1, by illustrating the dispersion of build-up (urban areas).
Figure 2: Tribal Authorities, National Parks and build-up areas
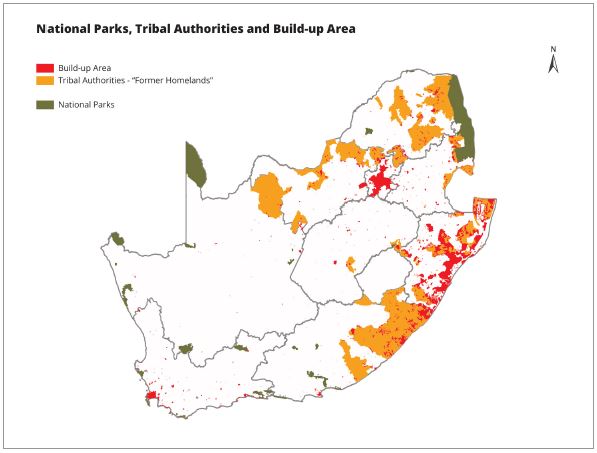
Source: Compiled by BFAP (2017) from: DAE (2017), DAFF (2016) and DWA (2006).
With the broader background provided by the previous Figures, the sections that follow focus on the ADS transactional data and results. These sections include an outline of the method and assumptions, an analysis of the transactional data and recommendations from the analysis.
Figure 3: Land Capability, Cash Crop Cultivated Land & Irrigated Land with National Parks, Tribal Authorities and Build-up Area indicated
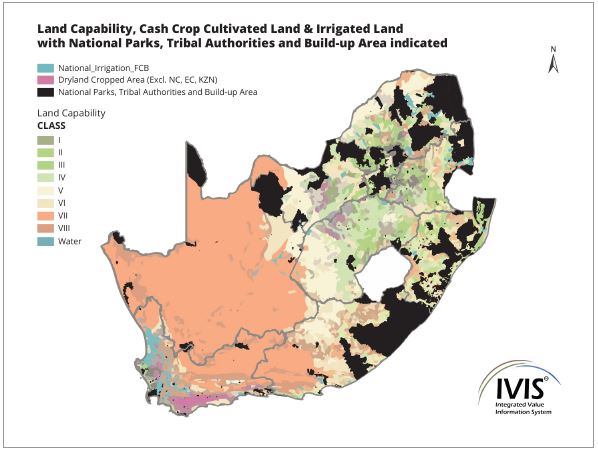
Source: AGIS (2008), DAFF (2014) & IVIS (2015)
1.2 Holistic View of Land Ownership
The general perception that land in South Africa is agricultural land exists. This perception is incorrect and this perception is incorrect and this report aims to clarify many of the facts pertaining to landownership. In in 2017 the general distribution of land can be summarised as:
|
Description |
1994 |
2016 |
||
|
Area in Ha (Million) |
% |
Area in Ha (Million) |
% |
|
|
|
|
|
|
|
|
Total area of South Africa1 |
122.5 |
100 |
122.5 |
100 |
|
Less: Other: Urbanisation, Industrial areas, Mining, Government, Privately owned conservation areas and National Parks |
25.5 |
21 |
29.2 |
25 |
|
Total agricultural land available |
97 |
79 |
93.3 |
76 |
It is disturbing to note that available agricultural land had declined by almost 4% over the past 23 years, from 97 million hectares to 93.3 million hectares. This is attributed to the increased number of mines, industry and the extension of municipal boundaries,
2. Method and Data
The following section outlines the approach and assumptions ADS used to compile the transactional data. In addition, Agri SA contracted the respected audit firm Nkonki as an external and independent party to perform a data validation analysis. The purpose of the Nkonki analysis was to sense check and validate the process that ADS followed, to ensure the reasonable reliability of the data used in this report.
2.1 Approach
ADS followed a quantitative and qualitative approach to determine the racial make-up of ownership of agricultural land, focusing on the period from 1994 to 2016.
The first step was to determine the breakdown for the 1994 basis period, which forms the starting point for the transactional data used in this report. The initial challenge was to account for the new provincial/geographical dispensation, changes to districts and to correctly link areas from the previous demarcation to the new demarcation. Following 1994, the country’s provincial geography changed, and certain districts ceased to exist as they were absorbed by other districts, based on the new provincial demarcation.
To establish the breakdown of ownership and agricultural land, ADS used geographic data sets from 1994 and 2016, supplied by Geo Terra Image. Data and software from the Office of the Surveyor General was also used. The Department of Agriculture, Forestry and Fisheries (DAFF) 1993 Agricultural census formed the basis to start the analysis of agricultural land in 1994.
To determine how land ownership evolved from the 1994 base, transactional data was sourced from the Deeds Office, using Windeed. Furthermore, supplementary data from Stats SA and DAFF were used. A functional web based platform was developed to allow users and researchers to access the database, which will be updated on a continuous basis.
The quantitative approach, used to package the transactional data, followed a step-wise process to link transactions associated with specific districts to the new, post-1994, geographical borders. Some of the previous (pre-1994) districts no longer exist and have been integrated with new districts from 1994. Data for transactions per district was obtained from the Deeds Office. In the transactional records, these transactions were linked to specific districts, based on the district within which the specific Deeds Office, where the transaction was recorded is located. Many of these districts fall outside of or overlap the current provincial composition and do not address the current allocation of districts.
The district associated with each transaction was cross referenced for correctness and adjusted to reflect the correct (or “new”) district where necessary. Following this, a process was followed to filter out all transactions involving land of more than 10 hectares and a value of more than R2,00 (two rand) and to enter this data in the database. The value of more than R2,00 was used to distinguish transfers of land from actual purchase transactions. The distinction between ‘sale’ and ‘transfer’ transactions is a key aspect to the compilation of the data.
Transfer transactions involve the exchange of ownership with money changing hands. Considering the rand/hectare value of land that exchanged ownership through a transfer along with the rand/hectare value of land that exchanged ownership through an actual sale can create a distorted view of land transactions and values, especially historical land values. In the Deeds Office’s data, transfer transactions which have negative transaction values, for example
-R2.00, indicate that a transaction is a transfer. For this reason, the data was separated into two databases, one to account for monetary ‘sale’ transactions and one to account for ‘transfer’ transactions. The second database was created to account for transactions involving land of more than 10 hectares, but with a transaction value of less than R2,00 (two rand). In addition, the ‘sale’ database also considered the transaction value and a calculation of a rand per hectare value. This was done per district and per province.
Furthermore, the data was cleaned to account for aspects such as duplicate transactions stemming from transactions recorded with more than one seller or buyer (family transactions). ADS engaged with Windeed, who contacted the Deeds Office to clarify and correct any transactions that appeared to be duplicates or that appeared to be incorrect information. Following this process, the cleaned transactional data was entered into the relevant (‘transfer’ or ‘sale’) electronic database, considering the hectares. Once the data was uploaded, specific program rules were applied to correctly sort the data into the required format.
Profiles were allocated to each transaction. The profiles considered land use, occupation and the race of the land owner. To determine the race of land owners, ADS considered each person’s surname together with the specific area where the land is located. For example, a land owner with an Afrikaans surname, located in an area that is known to be owned by Previously Disadvantaged Individuals (PDIs), would be assumed to be a landowner classified as a PDI. Furthermore, traditionally white surnames would be assumed to indicate ownership by white people, while surnames associated with PDIs would be assumed to indicate ownership by PDIs.
In terms of ownership by companies or trusts, ownership was allocated to PDIs where ownership could be clearly identified. In cases where it could not be clearly identified ownership was allocated to white people. The term “PDIs” is used to indicate persons of African, Coloured and Indian decent.
The transactions where further divided per commercial agriculture, agribusiness, other commercial use, mining, parks and forestry. In the case of transactions involving PDIs, there was a distinction made between government purchases of land, town and city development, private transactions involving agricultural land and private transactions involving land which is not necessarily used for agriculture.
Throughout this process, 453 967 lines of transactional data was considered, from which 179 068 transactions fell into the first data set and 42 543 fell onto the second data set. In total 221 610 transactions were individually analysed and incorporated into the database.
An additional consideration was the ownership of agricultural land in terms of the land’s potential. As an example, a large piece of land with low potential/fertility will produce less than a relatively smaller piece of land with a high potential/fertility. Accordingly, considering ownership of land in terms of the size in hectares does not account for differences in the potential of the land. This is an important distinction when considering the racial make-up of land ownership.
2.2 Land Potential
Carrying capacity was used as the starting point to consider the ownership of land in terms of land potential. Carrying capacity refers to the number of grazing animals (as per Large Stock Unit: LSU) a piece of land can support. The calculations involving carrying capacity where based on estimates by DAFF. Land potential does not refer to carrying capacity only, from a holistic perspective Land potential can be best described as land fertility.
Using the filtered and validated data, ADS provided Agri SA with the key results for land transactions from 1994 to 2016. The results provide details in terms of the two databases discussed above.
The results from database one is summarised on a national and provincial level in terms of the:
- Size of all land traded, giving the number of transactions and sub-divided into the following sizes: less than 50 hectares, 50 to 150 hectares, 150 to 300 hectares and greater than 300 hectares;
- Price of land traded, providing details on the total hectare traded, the total cost (R million) and the price per hectare;
- Composition of transactions in terms of race and the key role-players: Government, private and other.
The results for database two contains similar information, however, it does not include prices, since these transactions relate to transfers and not sale transactions where money changed hands.
2.3 External Data Validation
Agri SA appointed Nkonki Pretoria (Nkonki) to perform an independent and external data validation analysis of the transactional data provided by ADS. Nkonki is a firm of registered auditors, accountants and advisors.
The data validation involved a review of the systematic approach that was used from receiving the raw data, cleaning the data, uploading the data to the electronic platform and the final sense checking of the results. In addition to reviewing the process, Nkonki replicated the approach by using a selected sample of the raw data.
Nkonki’s high-level findings and observations include the following:
Understanding the process of data gathering and data adjustments
- “We engaged with ADS to obtain an understanding of the process of data gathering and adjustments; we found the process to be adequately designed and a review of the systematic approached proved to be reasonable.”
Determining the integrity of data being used
- “We inspected the source data used by ADS from Windeed; by means of a sample of transactional data processed into the system, we confirmed that the data’s integrity entered into the system is maintained. Manual intervention is applied to limited fields which require specialist knowledge and professional judgement. Data sets of this volume have an inherent risk of containing errors and omissions.”
- “At reporting level limited intervention occurs, reducing the risk to inaccuracies.”
Establishing whether the objective of the project is reached
Through enquiry from the project leader of AGRI SA, Annelize Crosby, the following was determined:
- “The data produced by ADS is corroborated by research projects of a similar nature which is administered independently from the project being reported on.”
- “The results produced by ADS is useable and deemed reasonable by experts in the field.”
2.4 Areas for Future Research
The aim of this report is to inform the policy debate on land ownership, using transactional data to give a more accurate view of the status quo. We acknowledge that the data is based on specific assumptions for the racial make-up of land ownership. However, the approach and data were validated through an external review, performed by Nkonki.
The results give a broader perspective on the racial make-up of land ownership, based on the available data and transparent assumptions. The transactional data does not currently include details on land ownership by companies and trusts. It is not possible to apply the same assumptions as was used for the private/individual ownership statistics.
Agri SA’s longer-term aim is to collaborate with ADS as well as key academic and government stakeholders to enhance the breadth of reliable data on land ownership in South Africa. A more detailed breakdown of government owned land, specifically in terms of land that could be used for agriculture, forms part of this strategy.
Collaboration with Government will be key to incorporating this additional level of detail. The overall vision is to expand the breadth and detail of data on land ownership, to update the data over time and to make a constructive contribution to the land policy debate in South Africa.
Financial models that will enable more PDI’s to access agricultural land will be developed. Research can also be done into access to water and water rights as it relates to land which was transferred to PDI’s.
3. Analysis
The transactional data was used to compile an estimate of the racial make-up of land ownership for 1994 and 2016. The ownership of agricultural land is the focus of this analysis and the key indicator is the share of ownership held by PDIs and Government. We have used a graphical representation of South Africa and the nine provinces. To view the ownership share in the correct relative proportions, we indicate the relative size of agricultural land in South Africa and in each province. Then we indicate the ownership share, by PDIs and Government, as a proportion of agricultural land. The key areas for ownership comparison are 1994 and 2016.
3.1 Land Ownership Overview
Land ownership in 1994 is the starting point from which to view the progress achieved by 2016. Note that most of the land reform transactions were only initiated from the around the year 2000. Before 2000, specific reform policies had to be developed and hence little implementation took place. To provide an overview of land ownership by PDIs and Government from 1994 to 2016, we have summarised key components of the evolving ownership process in Table 1.
Table 1: Land ownership by PDIs and Government: 1994-2016
|
Category |
Hectare (ha) |
|
Government land 2 |
13 814 336 |
|
TBVC, self-governing states trust land (Augustus 1994) 3 |
18 036 773 |
|
|
|
|
1994 – 2016: |
|
|
Government land bought for agriculture 4 |
2 208 031 |
|
Government land bought for town/urban development 5 |
641 267 |
|
|
|
|
Financial compensation 6 |
2 772 457 |
|
|
|
|
Private purchases by PDIs 7 |
4 373 376 |
|
Urban development (not agriculture) 8 |
1 708 527 |
|
|
|
|
Total |
43 554 767 |
|
Less land PDIs sold to white people (Landbou.com) 9 |
388 570 |
|
|
|
|
Net total: Land ownership by PDIs and Government |
43 166 197 |
Source: Based on ADS data.
Based on the transactional data for the period 1994 to 2016, a total of 8,9 million ha was bought by PDIs and Government at a total value of R90,3 billion. The 8,9 million ha equates to 12.9% of the total hectares that were traded. The R90,3 billion equates to 22,5% of the total value of land traded over the 1994 to 2016 period. From this, the Government purchased a total of 2,8 million ha at R20.5 billion. The 2,8 million ha represents 31.9% and the R20.5 billion represents 22.7% of the land bought by PDIs and Government. Note that this includes agricultural land as well as land bought for urban development.
What the data tells us is that:
- Agricultural land in South Africa today represents approximately 76% of the total land surface of around 122.5 million ha.
- Government land and the former TBVC, self-governing states and trust land represents 31.85 million ha and 25% of the land surface in South Africa.
- Government programmes for the purchasing of agricultural land yielded 2.2 million ha, where private purchases by PDIs amounted to 4.3 million ha. This is a key indicator that private sector agrarian transformation takes place much faster than government programmes.
3.2 Land Ownership in 1994
Considering land ownership by hectares in 1994, the ownership shares were allocated to the new 1994 demarcation as outlined in section 2.1. The country’s useable land which could be classified as agricultural land in 1994 amounted to 79.3%. In terms of ownership by PDIs and Government, approximately 14.9% of agricultural land was owned by PDIs and Government. This includes communal land from the previous dispensation. The remaining agricultural land was owned by white commercial farmers.
This is illustrated in Figure 5 below.
Figure 4: National level of ownership in 1994
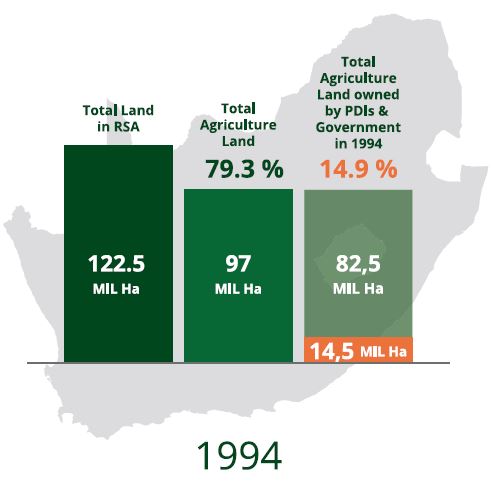
Source: Based on ADS data.
Note: Ownership share is calculated in terms of hectares of agricultural land owned
The provincial level of ownership by PDIs and Government is summarised in Figure 6 below.
Figure 5: Provincial level ownership in 1994
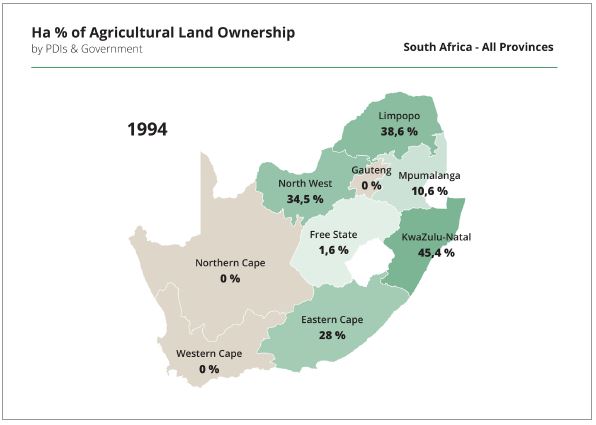
Source: Based on ADS data.
Note: Ownership share is calculated in terms of hectares of agricultural land owned.
3.3 Land ownership in 2016
The cut-off period for comparing ownership is 2016. Note that on a national level, the amount of land considered as agricultural land decreased from approximately 79.3% in 1994 to 76.3% in 2016. This reduction can be linked to the expansion of urban areas, conservation areas, forestry and mining. The national level ownership of agricultural land by PDIs and Government, in terms of hectares, increased from 14.9% in 1994 to 26.7% in 2016, whilst considering the reduction of overall agricultural land from 1994 to 2016.
The national level of ownership for 2016 is illustrated in Figure 7 below.
Figure 6: National level ownership in 2016
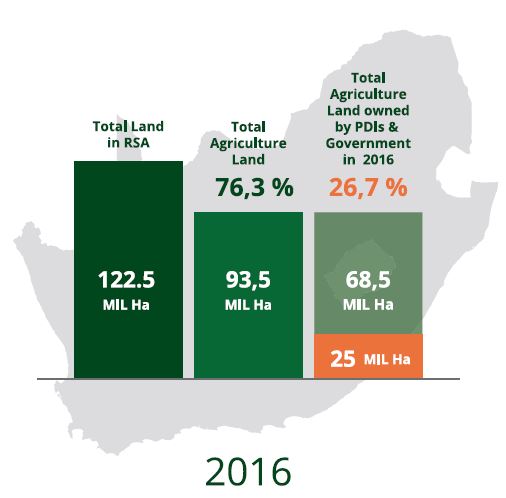
Source: Based on ADS data.
Note: Ownership share is calculated in terms of hectares of agricultural land owned.
The provincial level of ownership by PDIs and Government is summarised in Figure 9 below.
Figure 7: Provincial level of ownership by PDIs and Government in 2016
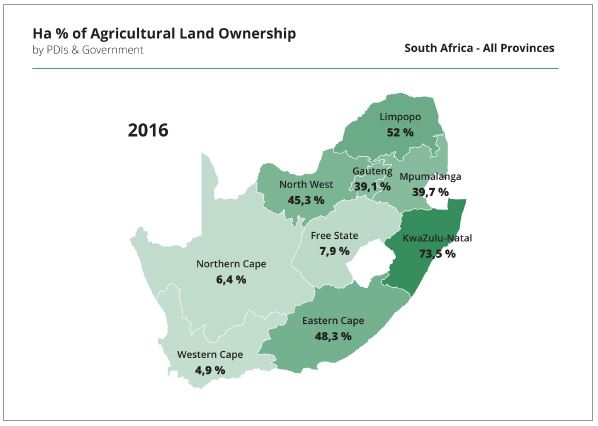
Source: Based on ADS data.
Note: Ownership share is calculated in terms of hectares of agricultural land owned.
Figure 8: Land ownership comparison for the Western Cape

Source: Based on ADS data.
Note: Ownership share is calculated in terms of hectares of agricultural land owned.
Figure 9: Land ownership comparison for the Northern Cape
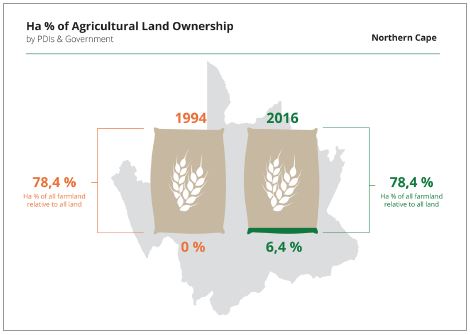
Source: Based on ADS data.
Note: Ownership share is calculated in terms of hectares of agricultural land owned.
Figure 10: Land ownership comparison for the Free State
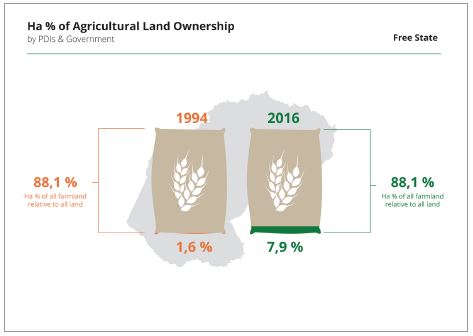
Source: Based on ADS data.
Note: Ownership share is calculated in terms of hectares of agricultural land owned.
Figure 11: Land ownership comparison for the Eastern Cape
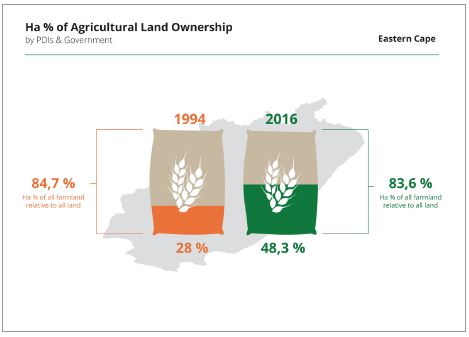
Source: Based on ADS data.
Note: Ownership share is calculated in terms of hectares of agricultural land owned.
Figure 12: Land ownership share for KwaZulu-Natal
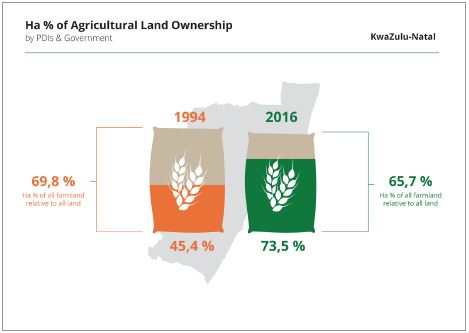
Source: Based on ADS data.
Note: Ownership share is calculated in terms of hectares of agricultural land owned.
Figure 13: Land ownership comparison for Mpumalanga

Source: Based on ADS data.
Note: Ownership share is calculated in terms of hectares of agricultural land owned.
Figure 14: Land ownership comparison for Limpopo
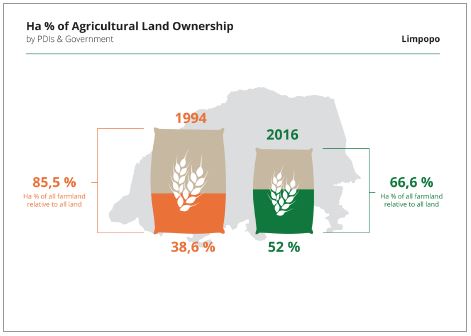
Source: Based on ADS data.
Note: Ownership share is calculated in terms of hectares of agricultural land owned.
Figure 15: Land ownership share for Gauteng
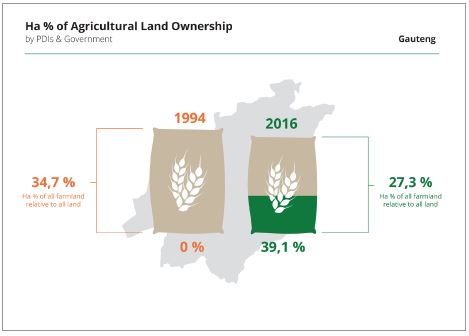
Source: Based on ADS data.
Note: Ownership share is calculated in terms of hectares of agricultural land owned.
Figure 16: Land ownership comparison for the North West
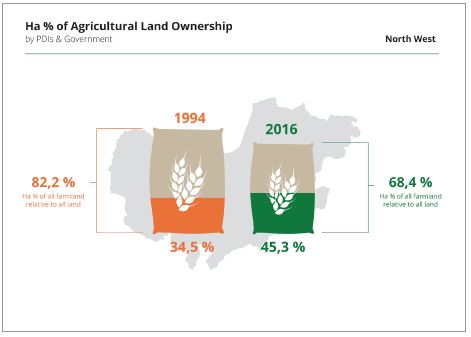
Source: Based on ADS data.
Note: Ownership share is calculated in terms of hectares of agricultural land owned.
The share of ownership can also be considered in terms of the value of the land owned as well as the land’s potential or ‘fertility’.
Considering the differences in the land potential between land located in different areas, ownership shares of PDIs and Government need to consider broader measures than the hectare land size alone. To provide a broader perspective on the progress with enhancing ownership by PDIs and Government, we consider PDIs and Government’s ownership shares in terms of the Rand value and the potential of the land that they own.
3.4 Ownership - Value and Land Potential
These ownership shares for 2016 are summarised in the Figure below.
Figure 17: PDI Ownership in terms of value and land potential for 2016
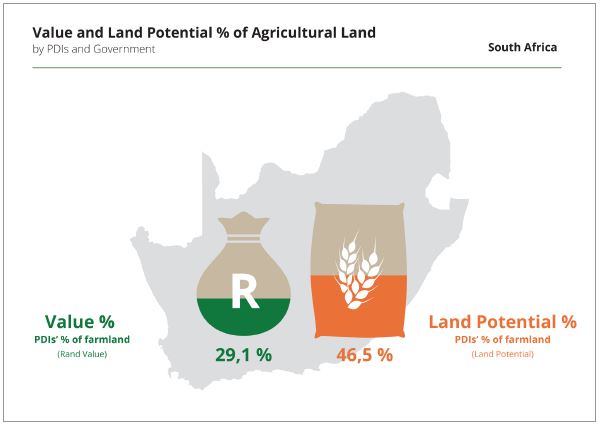
Source: Based on ADS data.
Note: Ownership share is calculated in terms of R value and land potential. The share of agricultural land in total land (76.3%) is calculated in terms of hectares.
When considering ownership share by PDIs and Government, in terms of the land’s value and the land’s potential, the ownership share increases significantly. In terms of R value, the share is 29,1% and in terms of land potential, the share is 46,5%. This compares more favourably against the 26,7% in terms of hectares owned. For the provincial level, these statistics are summarised and compared to PDIs and Government’s hectare ownership shares in Table 2 below.
Table 2: PDIs and Government’s provincial ownership shares for hectare, value and land potential in 2016
|
Province |
Hectare |
Value |
Land Potential |
|
Western Cape |
4,9 % |
7 % |
11,3 % |
|
Northern Cape |
6,4 % |
7 % |
12,3 % |
|
Free State |
7,9 % |
15 % |
18,7 % |
|
Eastern Cape |
48,3 % |
45,7 % |
54,1 % |
|
KwaZulu-Natal |
73,5 % |
59,6 % |
76,1 % |
|
Mpumalanga |
39,7 % |
34,4 % |
44,7 % |
|
Limpopo |
52 % |
50,6 % |
64,7 % |
|
Gauteng |
39,1 % |
38,8 % |
23,6 % |
|
North West |
45,3 % |
48,8 % |
36,8 % |
Source: Based on ADS data.
From Table 2:
- In terms of Hectare, more than 50% of the available agricultural land in both KwaZulu-Natal and Limpopo, while the Eastern Cape and North West are almost reaching 50%. This can be attributed to the land transfers based on the conclusion of land claims.
- In terms of land in monetary value, the ownership share is more than 50% of the respective provinces in KwaZulu-Natal and Limpopo, while being closely followed by the Eastern Cape and North West.
- In terms of land potential, PDIs and Government already own more than half of all agricultural land in three of South Africa’s most fertile provinces: the Eastern Cape, Limpopo and KwaZulu-Natal. Note that, on a national basis PDIs and Government control more than 46% of South Africa’s agricultural potential.
Furthermore, Table 2 illustrates the importance of considering ownership in terms of not only hectares, but also in terms of value and land potential. Considering ownership in terms of value relative to hectares, the ownership share increases for some provinces and decreases for others. However, on a national level, the ownership share increases. More importantly, considering ownership in terms of land potential shows the most significant increase in ownership share. The large ownership share, in terms of land potential, stems from the location of ownership in areas with a high agricultural potential and the location of many of the former homelands in these areas.
To add a further level of detail we consider a summary of the percentage breakdown of transactions involving PDIs and Government in terms of the number of transactions and hectares from 1994 to 2016. This detail is summerised in the Appendix.
4. Conclusion
4.1 Summary
Unfortunately, up to now, there has been a relative absence of statistics to inform the land policy debate. Agri SA believes that this report will serve to inform the debate and as organisation, we look forward to partnering with stakeholders to develop novel solutions that meaningfully improves the lives of all South Africans.
As a starting point, the amount of South African agricultural land is a crucial consideration for land policy. The amount of farmland has decreased from approximately 79.3% in 1994 to 76.3% in 2016. This reduction can be linked to the expansion of urban areas, conservation areas, forestry and mining. This is worrying, particularly when viewed in the context of an increasing population and urbanisation. Fewer farmers on less land need to feed a very large urban population. When considering farm ownership by PDIs, it must be in terms of the size of agricultural land relative to all other land.
Our analyses show that the market is quite effective in changing land ownership patterns. From the 1994 to 2016 transactional data, a total of 8,9 million ha was bought by PDIs and Government at a total value of R90,3 billion. The 8,9 million ha equates to 12.9% of the total hectares that were traded. The R90,3 billion equates to 22,5% of the total value of land traded over the 1994-2016 period.
Government purchased a total of 2,8 million ha at R20.5 billion. The 2,8 million ha represents 31.9% and the R20.5 billion represents 22.7% of the land bought by PDIs and Government. Note that this includes agricultural land as well as land bought for urban development.
Considering the differences in the land potential between land located in different areas, ownership shares of PDIs and Government need to consider broader measures than the hectare land size alone. To provide a broader perspective on the progress with enhancing ownership by PDIs and Government, we considered PDIs and Government’s ownership shares in terms of the Rand value and the potential of the land that they own.
In terms of the land’s value and the land’s potential, PDIs and Government’s ownership share increased significantly. On a national level: in terms of value, the share is 29,1% and in terms of land potential, the share is 46,5%. These statistics compare favourably against an ownership share of only 14.9% in 1994 (based on land size).
The broad RDP land ownership target for PDIs of 30% is clearly well within range now. Further analysis of the data may reveal to what extent the 20% per district target set in the NDP has been achieved.
These broader statistics indicate a greater level of ownership by PDIs, than is commonly suggested in debates arguing for extreme transformation policies and laws. Rather than pursuing these extreme policies, which are very likely to result in serious unintended consequences, land reform policy makers should take note of the insights provided by this report. Agri SA hopes that this report will lead to a more balanced, fact-based debate on land reform.
4.2 Areas for Future Research
The ownership of land by the Government is an area that should be investigated further. Agri SA believes that land acquired by the Government for land reform purposes should be transferred to beneficiaries and not remain in the hands of the state indefinitely. Large amounts of Government owned land could potentially be transferred to PDIs and this would improve ownership levels even further.
Importantly, a partnership approach should be followed where the Government partners with commercial agriculture to ensure new farmers are equipped with the necessary skills to make a success of their farming endeavours. Equally important, is Government led facilitation to assist these farmers to get access to the necessary operational funding required to run their farms. This could be supported by potential interest rate subsidies from the Government.
Agri SA’s longer-term aim is to collaborate with ADS as well as key academic and government stakeholders to enhance the accuracy and breadth of data on land ownership in South Africa.
A more detailed breakdown of government owned land, specifically in terms of land that could be used for agriculture, forms part of this strategy. Collaboration with Government will be key to incorporating this additional level of detail. The overall vision is to expand the breath and detail of data on land ownership, to update the data over time and to make a constructive contribution to land policy in South Africa.
4.3 Recommendations
To ensure effective and sustainable policy formulation, land policy should be based on a factual foundation. This land audit provides such a foundation, along with research on which projects are sustainable as well as key lessons learnt over years of involvement, supporting previously disadvantaged farmers.
As part of this report, Agri SA will develop a new, partnerships-based, solutions strategy to help solve the problems faced by land policy makers. Agri SA believes forming partnerships is the best approach to follow. This can take place along the following interlinked channels:
1. A new drive by Government to transfer Government owned land to emerging farmers, in partnership with commercial agriculture to facilitate a skills transfer;
2. Government support of a market based approach, where Government owned land is transferred to PDI farmers, allowing them to obtain ownership and collateral for debt funding. This collateral can serve to secure access to operational and development funding; and
3. Leveraging novel financing models to support emerging “renting” farmers to purchase land.
Agri SA has already developed a set of financing models, which can be leveraged to support the proposed channels outlined above. Such a partnership is very likely to increase the rate of successful market transfers to PDIs.
Appendix
To add a further level of detail we consider a summary of the percentage breakdown of transactions involving PDIs and Government in terms of the number of transactions and hectares from 1994 to 2016. Again, note the important distinction between monetary transactions that involve a monetary exchange and transfer transactions which do not involve an exchange of money.
Monetary Transactions
Monetary transactions are summarised in the Table A1 and A2, in terms of the percentage breakdown for the number of transactions and the hectare value of transactions respectively. Transfer transactions are summarised in Table A3 and A4, in terms of the percentage breakdown for the number of transactions and the hectare value of transactions respectively.
Table A1: Percentage breakdown: number of monetary transactions 1994 to 2016
|
Province |
Government Agriculture |
Government Urban |
Private Agriculture |
Other |
Total |
|
Western Cape |
1% |
1% |
2% |
1% |
5% |
|
Northern Cape |
2% |
1% |
3% |
2% |
8% |
|
Free State |
2% |
1% |
5% |
1% |
9% |
|
Eastern Cape |
2% |
1% |
9% |
2% |
14% |
|
KwaZulu-Natal |
3% |
1% |
22% |
2% |
28% |
|
Mpumalanga |
3% |
1% |
11% |
3% |
18% |
|
Limpopo |
2% |
0% |
12% |
2% |
16% |
|
Gauteng |
2% |
1% |
10% |
2% |
15% |
|
North West |
2% |
0% |
9% |
1% |
12% |
|
National Level |
2% |
1% |
9% |
2% |
14% |
|
Overall Total Transactions |
124 655 |
||||
|
Total Transactions for PDIs and Government |
16 729 |
||||
Source: Based on ADS data.
Note: The above table relates to the percentage breakdown of transactions involving PDIs and Government in terms of the number of monetary transactions from 1994 to 2016. This information does not provide information on the ultimate ownership, rather it is an indication of transactions involving PDIs and Government.
From Table A1, on a national level and in terms of the number of monetary transactions, 14% of the transactions involved PDIs and Government, note that this will differ when measured in terms of hectares traded. The composition, on a national level, includes 2% of transaction for government agricultural land, 1% for government urban land, 9% private land (specifically for agricultural land) and 2% for land involving activities outside agriculture.
On a provincial level; for example, KwaZulu-Natal and Limpopo have a large share of transactions falling in the private category, specifically for agricultural land. Interestingly, these provinces correspond to areas with high potential land.
Table A2: Percentage breakdown: monetary transactions in hectares 1994 to 2016
|
Province |
Government Agriculture |
Government Urban |
Private Agriculture |
Other |
Total |
|
Western Cape |
1,3% |
0,1% |
2,2% |
1,9% |
5,5% |
|
Northern Cape |
3% |
1,9% |
2,5% |
2,2% |
9,6% |
|
Free State |
2,4% |
0,5% |
3,8% |
1% |
7,7% |
|
Eastern Cape |
3,2% |
0,5% |
4,4% |
2,3% |
10,4% |
|
KwaZulu-Natal |
5,4% |
0,7% |
24,3% |
2,8% |
33,2% |
|
Mpumalanga |
5,1% |
0,5% |
11,2% |
8,7% |
25,5% |
|
Limpopo |
2,9% |
0,2% |
11,6% |
2,5% |
17,2% |
|
Gauteng |
4% |
1,5% |
10% |
3,4% |
18,9% |
|
North West |
4,7% |
0,9% |
8,6% |
1,6% |
15,8% |
|
National Level |
3,2% |
0,9% |
6,3% |
2,5% |
12,9% |
|
Overall Total (hectares) |
69,153 million |
||||
|
Total for PDIs and Government (hectares) |
8,931 million |
||||
Source: Based on ADS data.
Note: The above table relates to the percentage breakdown of transactions involving PDIs and Government in terms of monetary transactions in hectares from 1994 to 2016. This information does not provide information on the ultimate ownership, rather it is an indication of transactions involving PDIs and Government.
From Table A2, on a national level, in terms monetary transactions in hectares, 12,9% of the transactions involved PDIs and Government. The composition, on a national level, includes 3.2% of transaction for government agricultural land, 0,9% for government urban land, 6,3% private land (specifically for agricultural land) and 2,5% for land involving activities outside agriculture.
On a provincial level; the private category exhibits a similar theme to that discussed for Table A1.
The following tables relate to transfer transactions.
Table A3: Percentage breakdown: number of transfer transactions 1994 to 2016
|
Province |
Government Agriculture |
Government Urban |
Private Agriculture |
Other |
Total |
|
Western Cape |
3% |
5% |
0% |
3% |
11% |
|
Northern Cape |
3% |
3% |
2% |
8% |
16% |
|
Free State |
5% |
7% |
1% |
4% |
17% |
|
Eastern Cape |
11% |
4% |
3% |
3% |
21% |
|
KwaZulu-Natal |
7% |
5% |
13% |
4% |
29% |
|
Mpumalanga |
9% |
11% |
6% |
3% |
29% |
|
Limpopo |
15% |
8% |
5% |
2% |
30% |
|
Gauteng |
9% |
20% |
2% |
4% |
35% |
|
North West |
7% |
6% |
4% |
2% |
19% |
|
|
|||||
|
National Level |
8% |
8% |
4% |
3% |
23% |
|
|
|||||
|
Overall Total Transactions |
29 978 |
||||
|
Total Transactions for PDIs and Government |
6 662 |
||||
Source: Based on ADS data.
Note: The above table relates to the percentage breakdown of transactions involving PDIs and Government in terms of the number of transfer transactions from 1994 to 2016. This information does not provide information on the ultimate ownership, rather it is an indication of transactions involving PDIs and Government.
From Table A3, on a national level and in terms of the number of transfer transactions, 23% of the transactions involved PDIs and Government, note that this will differ when measured in terms of hectares transferred. The composition, on a national level, includes 8% of transaction for government agricultural land, 8% for government urban land, 4% private land (agricultural and other land) and a further 2% for land involving other activities.
On a provincial level; the government agriculture category has the highest share in Limpopo and the Eastern Cape. For the private category the highest share is for KwaZulu-Natal.
Table A4: Percentage breakdown: transfer hectares 1994 to 2016
|
Province |
Government Agriculture |
Government Urban |
Private Agriculture |
Other |
Total |
|
Western Cape |
5,1% |
16,4% |
0,4% |
0,5% |
22,4% |
|
Northern Cape |
11,2% |
5,2% |
3,9% |
2% |
22,3% |
|
Free State |
8,8% |
20,6% |
2,2% |
2,6% |
34,2% |
|
Eastern Cape |
16% |
5,5% |
2% |
4,1% |
27,6% |
|
KwaZulu-Natal |
7,3% |
10% |
67,7% |
1,5% |
86,5% |
|
Mpumalanga |
26,6% |
17,2% |
2% |
6,1% |
51,9% |
|
Limpopo |
42,9% |
5,3% |
8,3% |
1,4% |
57,9% |
|
Gauteng |
16,8% |
17,4% |
2,4% |
6,8% |
43,4% |
|
North West |
17,4% |
8,9% |
8,8% |
2,9% |
38% |
|
|
|||||
|
National Level |
14,1% |
10,5% |
19,5% |
2,3% |
46,4% |
|
|
|||||
|
Overall Total (hectares) |
25,691 million |
||||
|
Total for PDIs and Government (hectares) |
11,945 million |
||||
Source: Based on ADS data.
Note: The above table relates to the percentage breakdown of transactions involving PDIs and Government in terms of transfer transactions in hectares from 1994 to 2016. This information does not provide information on the ultimate ownership, rather it is an indication of transactions involving PDIs and Government.
From Table A4, on a national level and in terms of the number of transfer transactions in hectares, 46,4% of the transactions involved PDIs and Government. The composition, on a national level, includes 14,1% of transaction for government agricultural land, 10,5% for government urban land, 19,5% private land (agricultural and other land) and a further 2,3% for land involving other activities.
On a provincial level; the government agriculture category has the highest share in Limpopo and North West. For the private category the highest share is for KwaZulu-Natal.
Footnotes:
1 Source: ADS Data used as the base, calculating the remainder of land in the country.
2 Government land transferred to the Democratic Government in 1994.
3 TBVC, self-governing states and trust land (18 036 773 ha) transferred to the Democratic Government in 1994.
4 Land purchased by Government for transformation purposes.
5 Government purchases for town/urban development.
6 Commission on Restitution of Land Rights, (2017). Annual Performance Plan 2017/2018 - presentation to the Portfolio committee rural development and land reform.
7 Private purchases by PDIs amounted to 4 373 376 ha for agricultural land.
8 Private purchases by PDIs and Government of urban and other non-agricultural land.
9 Land owned by PDIs sold to non-PDIs.
Issued by Agri SA, 1 November 2017
