
Should National Development Plans be revised?
5 February 2019
National Development Plans are revised periodically, often at five year intervals. Although our National Development Plan 2030: Our Future – make it work(NDP) was launched in 2012, it has not been revised. Perhaps some believe that it should not be revised, and that work on a new plan should start in about a decade’s time.
This is not our view. The most famous five year plans were those of the Soviet Union. “Five for the years of the five year plan, four for the years that it took them”, ran an old Communist ditty and the illusion could be sustained for a time. As will appear below, the illusion that the goals of the NDP are achievable cannot be sustained for a minute. A rethink is due.
GROSS DOMESTIC PRODUCT
The NDP specified that Gross Domestic Product (GDP) should increase by 2.7 times in real terms, requiring average annual GDP growth of 5.4 percent over the period[1]. According to the IMF, Gross Domestic Product in 2010 was R 2 748 billion, implying a target of R 7 420 billion in 2010 prices. 2010 prices will be used throughout this brief. To convert to 2019 prices, 2010 prices should be multiplied by 1.64.
We can establish a base line projection of GDP using IMF projections to 2023[2] and project beyond that year using growth rates for South Africa projected in the OECD long term projection[3]. These yield a projected GDP of R 4 112 billion in 2030 and R 5 404 billion, implying that (a) GDP in 2030 will be only 55% of the NDP target and (b) the 2030 target will not be reached even in 2040.
POPULATION
The United Nations World Population Prospects (the 2017 revision) estimates the South African population at 51 585 000 in 2010 and its medium projection for 2030 is 64 466 000. By contrast, the NDP estimated the population in 2012 as 50 600 000 and had five projections for 2030, depending on circumstances[4]. The median projection[5] was 58 400 000. The United Nations projection is 10% higher.
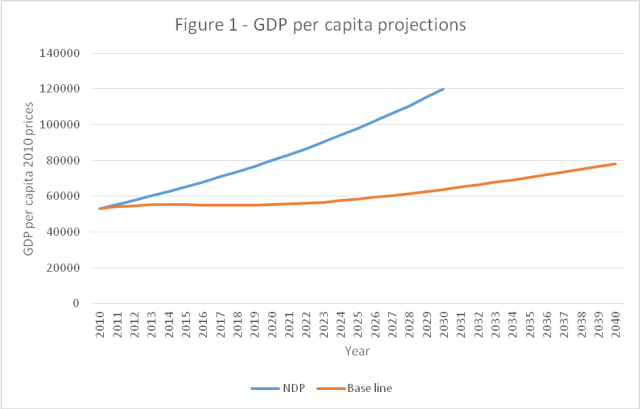
GROSS DOMESTIC PRODUCT PER CAPITA
Figure 1 compares the NDP projection of GDP per capita with the base line projection. The NDP aims to raise per capita income from R50 000 in 2010 to R120 000 by 2030 (a 140% increase), an annual rate of increase of 4.5%[6]. Our base line projection is that GDP per capita rises from R 53 272 in 2010 to R 63 780 in 2030 (a 20% increase), implying that GDP per capita in 2030 will be only 53% of the NDP target. GDP per capita is expected to be stagnant for the better part of a decade, surpassing its 2014 level for the first time in 2021.
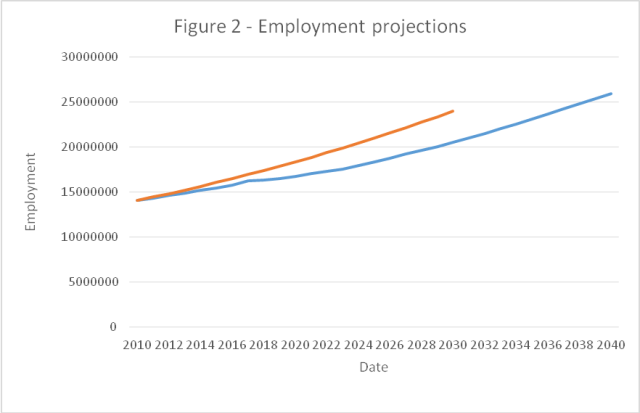
EMPLOYMENT, THE EMPLOYMENT RATE AND UNEMPLOYMENT
For the period from 2010 to 2017, we use the PALMS employment series[7] from Data First at the University of Cape Town. We prefer the UN Population Prospects 2017 revision estimates by gender and age to those from the Actuarial Society of South Africa’s 2008 projection used by PALMS, and we raise the sample estimates to the UN projections. Accordingly, we get estimates of aggregate employment which are different from those of PALMS, while our employment rates[8] by gender and five year age group are identical to PALMS.
Deriving employment projections from GDP projections requires the use of an elasticity assumption. In fact, there are two relevant elasticities of employment, the first to GDP and the second to the wage level. The simplifying assumption here is that wage levels will continue to evolve according to the pattern between 2010 and 2017, so that elasticity with respect to GDP alone will be used in the projection. From the PALMS data, the average elasticity between 2010 and 2017 was 0.86, higher than the 0.62 used implicitly in the NDP projection. The good news is that the employment base line projection is closer to the NDP projection than the GDP per capita projection in 2030, as Figure 2 shows.
The bad news is that the unemployment rate is unlikely to come down by much, even with the optimistic employment projection. Using the gender and age specific labour force participation rates (based on a strict definition of unemployment) from the PALMS estimates for 2010 and 2017, one arrives at the rates for the 15+ population in Table 1.
Table 1 – Labour force participation rates among people age 15 and over, 2010 and 2017
|
Year |
Male |
Female |
Both genders |
|
2010 |
60.20% |
44.60% |
52.20% |
|
2017 |
62.50% |
48.90% |
55.50% |
Assuming that gender and age labour force participation rates are constant to 2030, the projection yields Table 2.
Table 2 – Strict unemployment rates, 2010 to 2030
|
Year |
Unemployment rate |
|
2010 |
24.70% |
|
2017 |
27.20% |
|
2020 |
26.80% |
|
2025 |
26.30% |
|
2030 |
25.80% |
The unemployment situation would be considerably worse if the labour force participation rate were to rise to 65%, as the NDP envisages, as opposed to the 55.4% in our base line projection[9].
INCOME DISTRIBUTION AND POVERTY
It is well established that the distribution of income is approximately lognormal, and a lognormal distribution is fully specified by two parameters, which can be estimated from mean income and the Gini coefficient[10]. The income concept of interest is household consumption per capita. The lognormal distribution makes it possible to estimate the percentage of the population living below three poverty lines as defined by Statistics South Africa:
1. The Food Poverty Line (FPL). This refers to the amount of money that an individual will need to afford the minimum required daily energy intake. It is R 3 840 per annum per capita in 2010 prices.
2. The Lower Bound Poverty Line (LBPL). This refers to the food poverty line plus the average amount derived from non-food items of households whose total expenditure is equal to the food poverty line. It is R 5 592 per annum per capita in 2010 prices.
3. The Upper Bound Poverty Line (UBPL). This refers to the food poverty line plus the average amount derived from non-food items of households whose food expenditure is equal to the food poverty line. It is R 8 796 per annum per capita in 2010 prices.
Household consumption as a proportion of GDP is published in the national accounts[11]. On average, it was 59.8% between 2010 and 2017, fluctuating within narrow margins. This provides the necessary link between GDP per capita and household income per capita.
The Gini coefficient is estimated at 0.69 in 2011. The NDP projects a drop to 0.60 in 2030, but in light of the analysis so far, this target is pushed out to 2040[12]. Gini coefficients in intervening years are linearly interpolated.
Table 3 – Percentages of the population in poverty, 2010, 2030 and 2040
|
Year |
FPL |
LBPL |
UBPL |
|
2010 |
23.10% |
37.40% |
44.10% |
|
2030 |
12.00% |
19.60% |
30.50% |
|
2040 |
6.60% |
12.20% |
21.40% |
The NDP projects zero poverty in 2030 – more of a rhetorical flourish than a statistically grounded projection[13].
Figure 3 presents Lorenz curves for 2010, 2030 and 2040. A Lorenz curve is read by choosing a percentile of the population (say the poorest 40%) on the horizontal access and then reading off the percentage of consumption it receives on the vertical axis.
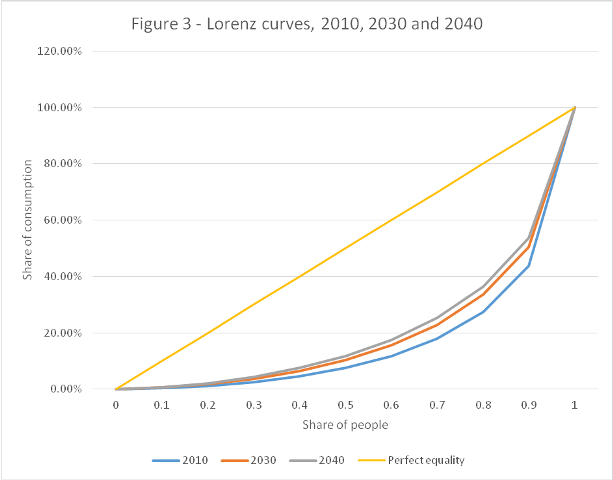
Table 4 sets out the percentage of household consumption by the bottom 40% of the population.
Table 4 – Share of the bottom 40% in household consumption
|
Source |
Year |
Share |
|
Base line projection |
2010 |
4.50% |
|
Base line projection |
2030 |
6.40% |
|
Base line projection |
2040 |
9.40% |
|
2010 |
6% |
|
|
2030 |
10% |
|
|
2015 |
8.30% |
There are ambiguities in household consumption data. They may refer to the consumption made possible from household earnings and property income, or they may take into account transfers from others in the private sector as well. Table 4 should be considered for the trends that it indicates more than a comparison of levels estimated in different sources. On this basis, the 2030 NDP target seems likely to be undershot, but the outcome will be affected by the development of income support policy.
CONCLUSIONS
1. A projection is not a prediction. It is what would happen if the model assumptions were satisfied. The outcome will depend on good or bad luck, which cannot be controlled, and on good or bad policy, which can.
2. It is possible to be overly influenced in the choice of assumptions by current mood. We have guarded against this possibility by using projections of GDP and population from international institutions: the IMF, the OECD and the UN. Accordingly, there are upside risks and downside risks to the base line projection. The upside risks are good luck and good policy. The downside risks are continuing stagnation, or even economic decline.
3. The NDP was intended to rally the nation around a high growth strategy. This it has failed to do so far. Instead of a growth rate of 5.4%, the average growth rate between 2012 and 2019 is estimated at 1.4%. The failure has the consequence that the economy will be much less advanced in 2030 than the NDP projection.
4. Projections which are unrealistically optimistic pose dangers. They can induce inappropriate policy on the provision of education, health, human settlement and income support, as well as poor public investment decisions.
5. In policy terms, attention to growth has been very limited since 1994, and non-existent over the past decade. This has not been for the lack of good advice, but for the unwillingness to take it. Professional educational discourse refers to cheating in examinations as ‘rapid learning technique’. Large swathes of our elite have been much more interested in rapid accumulation technique than pro-growth policy.
6. The fact that the NDP assumptions about GDP, employment and poverty are dated does not invalidate the many suggestions it contains about initiatives to improve the growth rate. Indeed, there is a need for a review of current status in relation to them.
7. There is no single factor which will move the country forward. For instance, increased foreign direct investment will help, but it needs to be accompanied by attention to factors limiting domestic investment in the domestic economy. Rather, what is needed is a series of mutually supportive measures to remove the constraints on growth, and this will require large changes in mentality. Unless these changes materialise, we shall continue our slide down the world economic league table.
By Charles Simkins, Head of Research, Agathe Fonkam, Researcher, and Tove van Lennep, Researcher, HSF, 5 February 2019
Appendix – The lognormal distribution
The lognormal distribution Λ(μ,σ) yields:
Mean eμ + σ^2/2
Gini coefficient 2Φ(σ/sqrt(2))-1
Where Φ is the cumulative density function of the normal distribution with mean zero and standard deviation of 1.
σ is estimated from the Gini coefficient formula, and substituted in the mean formula to enable μ to be estimated.
The mean income up to an income level z (one of the three poverty lines in this analysis) is given by:
Φ((ln z – μ – σ2)/σ)
This makes it possible to work out the proportion of total income accruing to the individuals in the bottom x% of the income distribution and the Lorenz curve.
[1] National Development Plan 2030, Summary of Objectives and Actions, p61
[2] Taken from the IMF World Economic Outlook database, October 2018
[3] OECD, Long term base line projections No 103, 2017
[4] National Development Plan 2030, Ch2 Demographic Trends, p99
[5]The median projection is associated with slowing economic development
[6] National Development Plan 2030, Overview, p34
[7] The Post-Apartheid Labour Market series is compiled by Andrew Kerr, David Lam and Martin Wittenberg, and is available on the Data First website, University of Cape Town.
[8] The employment rate is the ratio of employed persons to all persons
[9] National Development Plan 2030, Summary of Objectives and Actions, p61
[10] Technical notes are provided in the Appendix
[11] See SA Reserve Bank, Quarterly Bulletin, December 2018
[12] National Development Plan 2030, Overview, p34
[13] National Development Plan 2030, Ch3 Economy and Employment, p110
[14] National Development Plan 2030, Summary of Objectives and Actions, p61
[15] National Development Plan 2030, Summary of Objectives and Actions, p61
[16]Statistics South Africa, 2017, Poverty Trends in South Africa, p23
