
On the 2014 Matric results
Tuesday, 6 January 2015
Equal Education (EE) congratulates the students, schools, teachers and the DBE on the matric results of 2014. It is encouraging to see a clear attempt to improve the standard of the National Senior Certificate (NSC) [1].
This statement builds on our earlier statement (see Equal Education's ‘On the upcoming Matric results'). Some of the highlights are:
The overall matric pass-rate fell by 2.4% to 75.8%. But we don't necessarily take this to imply decline in the overall quality of education, just as we did not take the increases in previous years to necessarily indicate improvements.
The drop-out rate seems to be rising year-on-year and now sits at 50%. This is worrying.
The proportion of matrics enrolling in Maths and Physical Science is falling year on year. This is worrying.
The number of matrics qualifying for Bachelors or Diploma studies has fallen.
Threats to punish principals, while not putting the fundamentals in place, are possibly already producing perverse outcomes.
EE continues to caution against a narrow focus on the matric pass rate. It is not a good indicator of the overall health of the system, and it masks inequality.
Any attempt to use the ups and downs in the overall pass rate from year to year for party-political purposes is dangerous.
Focusing on the NSC results give us a very limited glimpse into the South African education system, where a number of problems hide lower down in the system, particularly in terms of learning outcomes (like in the development of basic numeracy and literacy skills), and the enormous drop-out rates between Grades 10 and 12 .[2]
Context
It is important that the matric results must be viewed in context. [3] It is also important to remember that the NSC pass rate indicates the percentage of students that passed a particular year's exams and met the minimum requirements to obtain the qualification in that particular year - very little else. Comparing the matric pass rate across years is problematic, as acknowledged by the DBE: "Examinations like our Matric are simply not designed to compare the performance of the schooling system across years". [4]
The pass rate fluctuates according to various factors, including the number of exam takers in a particular year, and the subject choices students make in a particular year (which might be desirable or undesirable - for instance, when we observe a shrinking percentage of students taking ‘gateway' subjects like Mathematics and Science). It is also influenced by the design and assessment of the exam papers - which is not unproblematic for South Africa (although this is a matter the DBE is trying to address). [5]
One of the biggest concerns, frequently noted, is the fact that approximately 50% of learners exit the system between Grades 10 and 12, leaving school without any formally recongnised education qualification. Students who never make it to matric face bleak economic prospects. Of those that do complete matric, most will find it very hard to find employment in our skills-intensive economy. [6]
Only a very small percentage will qualify for tertiary education (though this number is rising) and an even tinier percentage will likely go on to graduate. [7]
2014
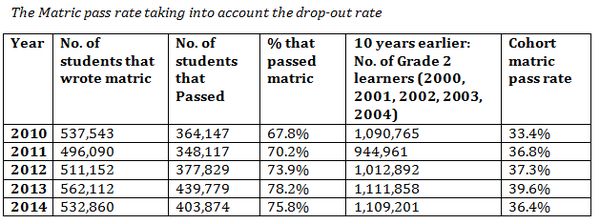
The DBE's 2014 National Senior Certificate ‘Technical Report', states that a total of 532 860 learners wrote the matric exam in 2014 (slightly less than the previous year), and 403 874 learners passed matric - a 75.8% pass rate, 2.4% lower than the previous year. [8]
Some factors that make the 2014 exams different include the phasing in of the CAPS curriculum (which means content has changed slightly from previous years); changes to the format, structure and depth of content in key subject like Mathematics and Science; and greater attention to the marking process (which was a big problem previously [see footnote 5]). [9] For the most part, these are welcome changes. We see that the DBE has responded to concerns over the standard of exam papers.
Drop-out
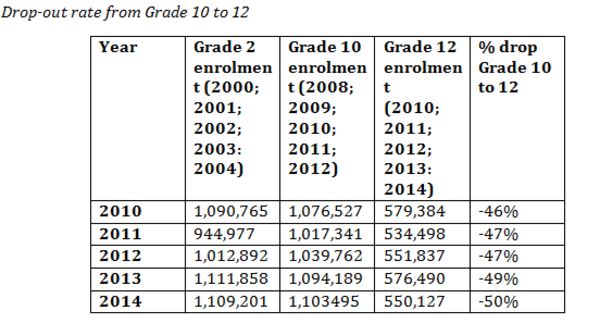
For some perspective on the pass rate, it is useful to take into account the serious drop-out rates mentioned earlier. We can approximate the age cohorts of students who started school together, in various years, and track them through the system. Starting in Grade 2 (where grade repetition is generally lower), we can identify 5 cohorts (2010-2014), and track them over a 10 year span. Approximately half of each cohort drops out before even reaching matric. The largest drop-out rates are in Grade 10 and 11. [10]
Looking at the number of student who wrote matric, we can create a 'cohort matric pass rate'. [11] The spectacular 78.2% pass rate of 2013 is now closer to a 40% pass rate, and we see the 2014 75.8% is actually closer to 36.4%.
Notably, the drop out rate appears to be steadily rising.
Opportunity
Of the 532 860 learners that wrote matric, 150 752 met the ‘minimum requirements' for Bachelor Studies (28.3%) and 166 689 (31.3%) qualified to study for a Diploma.
This is generally a decline from 2013 when 171 755 out of the 562 112 (30.6%) qualified for a Bachelor degree and 173 292 (30.8%) qualified to study for a Diploma. [12]
Maths and Science
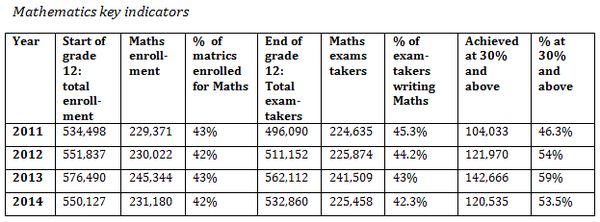
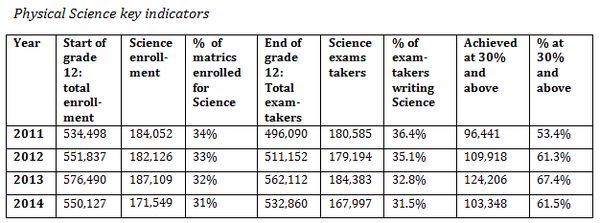
Looking at the enrolment numbers of Mathematics and Science (2011 to 2014), we see that the enrolment for Mathematics is very low (at 42% in 2014), and the enrolment in Physical Science is clearly dropping (currently it is at 31%) - this is an issue the DBE has flagged in their Technical Report, pg. 29). The decline is similar in the numbers and proportions for those who actually end up writing the exams in Maths and Physical Science.
We can see that a smaller proportion of the matric class enrolls for, and ends up writing, Maths and Science each year. This is a worrying trend. It should give us pause about using the overall matric pass rate as any indication of overall educational quality.
In the past there has, at least, been an upward trend in the pass rate for Mathematics and Physical science. In 2014, with format, structure and depth-of-content amendments to the Mathematics and Physical Science papers, we see a bit of a dip in the pass rate. Mathematics fell from approximately 59% in 2013 to 54% in 2014, and Physical Science fell from 67% in 2013 to 61% in 2014.
Bad Pressure
Schools are under enormous pressure to avoid being classified as ‘underperforming' schools. There are serious reports of mass-copying [13], mostly in the poorest and most under resourced schools and provinces (KwaZulu-Natal and the Eastern Cape). So is the intense focus on matric performance, and the language of punitive accountability creating perverse and counterproductive incentives?
EE has urged the Minister to use S58B of the South African Schools Act to implement a much more thorough and systemic approach to school improvement, which is not just measured by matric results. It would tell us more about systematic change if the same urgency was applied to improvements in school physical conditions, the availability of library and textbooks, curriculum coverage, teacher attendance, and the regularity of School Governing Body meetings. Public competitions between schools, districts and provinces on these and other indicators may be productive. They would be less prone to perverse incentives of the kind associated with an exaggerated focus on the matric results.
Conclusion
Focusing exclusively on the pass rate can be misleading. Up to 50% of students in South Africa drop out of school before matric. It is clear that students are moving away from Mathematics and Physical Science. Scores are generally very low. Students struggle to read and write. Provinces like the Eastern Cape and KwaZulu-Natal continue to struggle. EE therefore urges a more comprehensive view of the education system, and a greater focus on other grades and performance lower down in the system. [14]
Nombulelo Nyathela (EE spokesperson)
Yoliswa Dwane (Chairperson of the Equal Education National Council)
Wim Louw (EE Researcher)
NOTES
[1] See the DBE's 2014 Technical Report, Section 7 (pg. 39), URL: ; 2014 Matric of high standard: Experts' (23 November, 2014), URL See the Minister's speech here, URL.
[2] See, for instance, Nic Spaull's "South Africa's Education Crisis: The quality of education in South Africa 1994-2011", URL: ; Nic Spaull and Janeli Kotze (2014).'Starting Behind and Staying Behind in South Africa: The case of insurmountable learning deficits in mathematics'. Stellenbosch Working Paper Series No. WP27/2014; See also the 2013 DBE Diagnostics Report.
Others measures, which should be read with the matric results, are the Trends in International Mathematics and Science Study (TIMSS), the Southern and East African Consortium for Monitoring Educational Quality (SACMEQ) programme, and the Progress in International Reading and Literacy Studies (PIRLS), which provide an independent and comparative account of cohort performance over time and across different countries. The Annual National Assessment (ANA) is an important diagnostic tool too - but there are currently some problems in assessing the results across schools and across years, which might be resolved in time.
[3] See EE's Matric Results ‘Context Paper', URL:
[4] DBE (2014), 'The Matric Pass Rate. When Should We Celebrate', URL:
[5] A comprehensive 2014 report by the Ministerial Committee on the National Senior Certificate raises serious concerns about the formulation, design, and assessment of NSC exam papers. The report finds, for instance, that "2013 was by far the worst year for marking problems and this unfortunately coincide with the highest pass rate seen in the NSC" (p148). The DBE's efforts to address these issues are also mentioned, along with a number of recommendations. See SA Government Gazette, October 2012, Vol. 568, No. 35829, URL: , and the complete report, URL:
[6] See pg. 6 of the Statistics South Africa's Quarterly Labour Force Survey Quarter 2, 2014, URL:
[7] Department of Higher Education & Training (2014). 'Statistics on Post-School Education and Training in South Africa: 2012' (p14), URL:
[8] DBE 2014 Technical Report, URL:
[9]Umalusi Media Statement (30 December 2014), URL:
[10] Using the DBE ‘Education Statistics in South Africa: At a Glance' estimates (2000-2013), and the 2014 DBE Technical Report , the set of ‘quasi' cohorts reveals massive drop-out rates in enrolment between Grade 10 and Grade 12. The term ‘quasi cohorts' is Martin Gustafsson's. See: Gustafsson, M. (2011). ‘The when and how of leaving school: The policy implications of new evidence on secondary schooling in South Africa'. Stellenbosch Economic Working Papers. Gustafsson (2011), using the 2008 National Income Dynamics (NIDS) and 2009 General Household Survey (GHS), cites teenage pregnancy and financial constraints as the most reported reasons for dropping out, but we believe this requires further investigation.
[11] See, for instance, Nic Spaull (2014), 'Matric is failing SA's lost children', Mail & Guardian, URL:
[12] The DBE's website states that the NSC should be seen as a measurement of "the opportunities open to our youths"(see footnote 1), which the DBE attempts to do, in principle, by tracking the number of Grade 12 learners who become eligible for a higher education, and then the number of Grade 12 learners who pass Mathematics and Physical Sciences. The ‘minimum requirements' for tertiary study are defined by Higher Education South Africa (HESA): See the DBE 2013 NCS ‘Technical Report' (pg. 25), URL: .
[13] SABC (30 December 2014), '2014 matric exams marred by irregularities, cheating', URL: cheatinghttp://www.sabc.co.za/news/a/b5be058046c10f6a8ccafc68841f2d27/2014-matric-exams-marred-by-irregularities,-cheating-20143012
[14] See the statement by South Africa's Democratic Teacher's Union here, URL:
Statement issued by Equal Education, January 6 2015
Click here to sign up to receive our free daily headline email newsletter
