
Extract from Statistics South Africa, Census 2011: Statistical Release, October 30 2012
3.12 Labour market status
3.12.1 The labour market in South Africa
3.12.1.1 Introduction
The source of ‘official' labour market statistics in the country is the Quarterly Labour Force Survey (QLFS). Census 2011 also included labour market questions; however, the results may be different from those obtained from the QLFS completed in the fourth quarter of 2011 (QLFS_Q4:2011) for two main reasons. The reference period for employment in Census 2011 was fixed (the week before the Census night - 9 October 2011). In contrast, the QLFS used a moving reference period (the week prior to the date of the interview) over a three-month period.
The QLFS therefore included persons who were employed during the course of every month in the October-December quarter while in principle, the Census only included those employed in the first week of October. In addition, Census 2011 results are based on the de facto measure of the population while the QLFS is based on the de jure measure. As a result, the household questionnaire used in Census 2011 to collect labour market information was not intended for persons who either spent Census night in institutions or were transients. To the extent that these groups included employed persons, their labour market status would not be known, since they were only required to complete a shorter questionnaire which excluded labour market questions.
Comparisons of the results of the post-apartheid population Censuses over time will not be discussed here but will be analysed in detail in a forthcoming publication. Changes to key questions over the years mean that the labour market outcomes based on the post-apartheid Censuses and the Community Survey have to be analysed with caution.
The analysis in the first section compares the results of the population Census conducted in October 2011 (Census 2011) with the Quarterly Labour Force Survey (QLFS_Q4:2011) conducted in the fourth quarter of 2011 (October-December). The QLFS has not been benchmarked to the new population figures and the results are therefore only broadly indicative of the differences with Census 2011. The QLFS_Q4:2011 figures will therefore change after the benchmarking process. Although the analysis in the final section focuses only on the results of Census 2011, the patterns are similar to those in the QLFS_Q4:2011.
***
Key labour market concepts and definitions
Employed: Persons who work for pay, profit, or family gain, in the reference period.
Unemployed (official definition): Persons who did not work, but who looked for work and were available to work in the reference period.
Unemployed (expanded definition): Persons who did not work, but were available to work in the reference period.
Not economically active: Persons who were neither employed nor unemployed (e.g. full-time students; retired persons; and homemakers who did not want to work).
Labour force: Employed persons plus unemployed persons.
Working-age population: Persons aged 15-64 years.
Unemployment rate: Unemployed persons as a percentage of the labour force.
Labour force participation rate: Labour force as a percentage of the working age population.
Labour absorption rate: Employed persons as a percentage of the working age population.
Formal and informal sector: An objective measure is used in the QLFS based on VAT/income tax registration and establishment size, while a subjective measure is used in Census 2011. Also, in line with ILO guidelines, persons employed in agriculture and private households are not usually included in the formal and informal sectors, but are identified as separate categories. It is not currently possible to identify agricultural employment in Census 2011 since the coding of industry and occupation has not yet been completed. Sectoral distributions therefore include persons employed in agriculture. And with regards to persons employed in private households, the results are not based on the relevant questions that determine the international classification for industry but instead are based on the question which determines the sector in which respondents were employed. Thus, after coding is completed the numbers may change.
***
3.12.1.2 National labour market results from Census 2011 and the QLFS_Q4:2011
This section focuses on the national results of Census 2011 compared with the QLFS_Q4:2011 for key labour market indicators.
Table 3.8: Labour market outcomes in Census 2011 and QLFS_Q4:2011
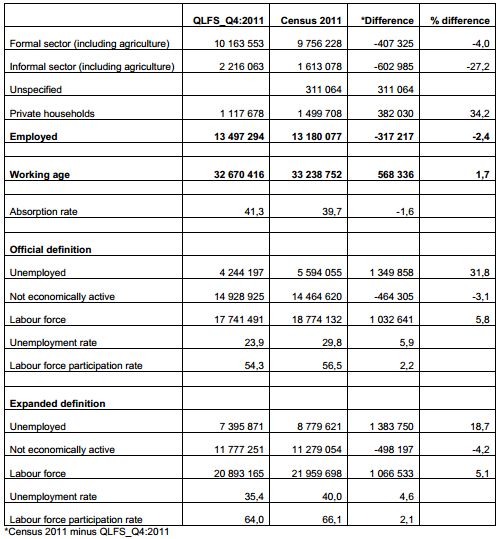
Table 3.8 shows that nationally, based on Census 2011, both formal and informal sector employment was lower than in QLFS_Q4:2011. As a result, the total number of employed persons was lower in Census 2011 by 317 217 (2,4%) than in QLFS_Q4:2011. This is largely due to the difference in the reference period used in Census 2011 (one week) compared with the reference period of three months used in the QLFS_Q4:2011. In effect, persons employed in short-term/casual jobs are more likely to be captured in QLFS than in Census 2011. Also, as discussed earlier, Census 2011 measured the de facto population while QLFS_Q4:2011 measured the de jure population.
Reflecting the employment outcomes, the labour absorption rate was lower in Census 2011 by 1,6 percentage points compared with the QLFS_Q4:2011. Based on the official definition, the difference in the labour force participation rate between Census 2011 and the QLFS was 2,2 percentage points. Based on the expanded definition, the difference was 2,1 percentage points.
The difference in the unemployment rate was somewhat larger. In terms of the official definition, the unemployment rate was 23,9% in the QLFS_Q4:2011 and 29,8% in Census 2011 - a difference of 5,9 percentage points. In terms of the expanded definition, the difference between the unemployment rates from the two instruments was smaller (4,6 percentage points).
3.12.1.3 Provincial labour market rates based on Census 2011 and QLFS_Q4:2011
The national labour market rates shown in Table 1 often mask large variations by province. This reflects differences in urbanisation as well as differences in the economic structure of the provinces.
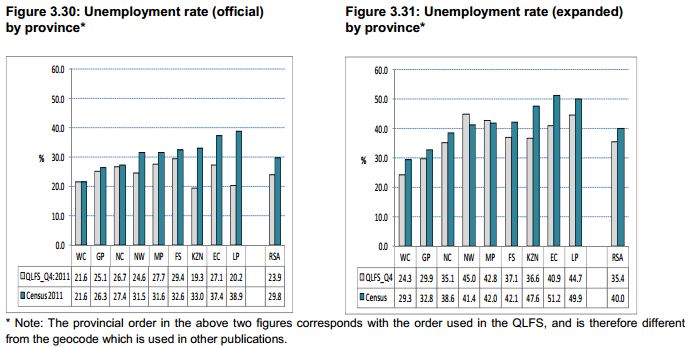
Figure 3.30 and Figure 3.31 show that, based on both the official and the expanded definitions, the difference in the unemployment rate between Census 2011 and QLFS_Q4:2011 is largest in KwaZulu-Natal, Eastern Cape and Limpopo. In these provinces, the informal sector accounts for a larger share of total employment compared to most of the other provinces, and this sector is known to generate short-term/casual jobs. The difference in the reference periods for employment in Census 2011 and the QLFS means that such jobs are more likely to have been captured in QLFS than in Census 2011.
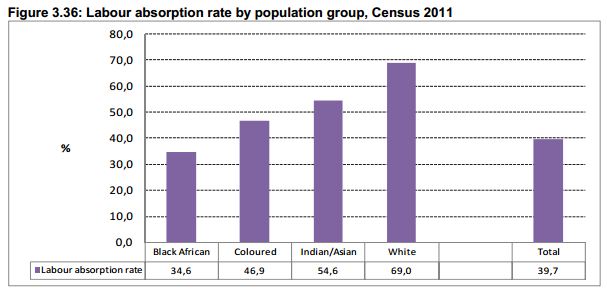
Figure 3.36 shows that employment opportunities among the black African population group are relatively scarce as indicated by the labour absorption rate which measures the percentage of persons aged 15-64 years who were employed. Among black Africans aged 15-64 years, 34,6% were employed; among the coloured population group aged 15-64 years, 46,9% were employed; among Indians/Asians aged 15-64 years, 54,6% were employed; and among the white population group of a similar age group, 69,0% were employed. A similar pattern is observed in the QLFS.
3.12.1.5 Key labour market rates by sex and population group, based on Census 2011
The national labour market results mask variations by sex and population group.
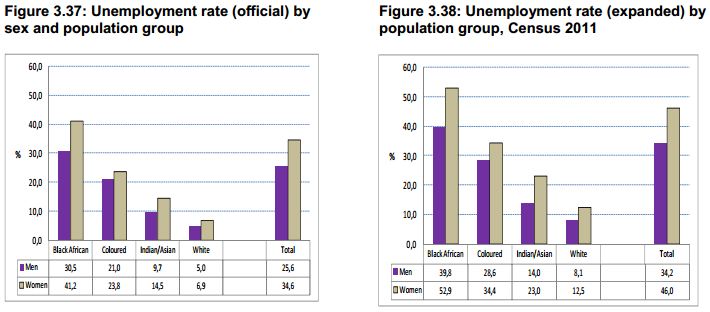
Unemployment rates among women are higher than those among men. Nationally, based on the results of Census 2011, the official unemployment rate among men was 25,6% while among women it was 34,6% (Figure 3.37).
Based on the expanded definition, the unemployment rate among men was 34,2% while among women it was 46,0%. Figure 3.37 and Figure 3.38 also show that the unemployment rate (official and expanded) among white men is lower than that for other groups, while the rate among black African women is the highest by a large margin.
Based on the official definition, Figure 3.37 also shows that the unemployment rate among white men was 5,0% while among black African women it was 41,2%. Based on the expanded definition, the unemployment rate among white men was 8,1% while among black African women it was 52,9% (Figure 3.38). These patterns are also observed in the QLFS.
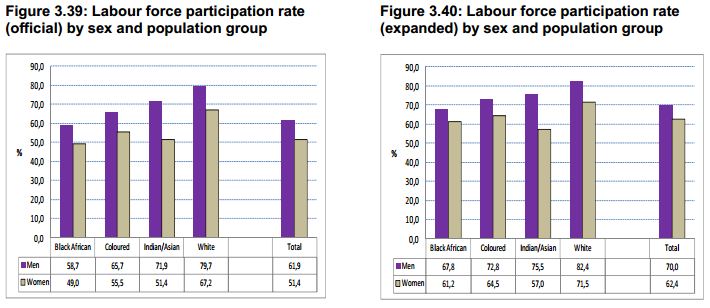
Figure 3.39 shows that the labour force participation rate (official) is lowest among women in the black African population group and highest among men in the white population group. Based on the expanded definition, Figure 3.40 shows that the labour force participation rate is lowest among women in the Indian/Asian population group.
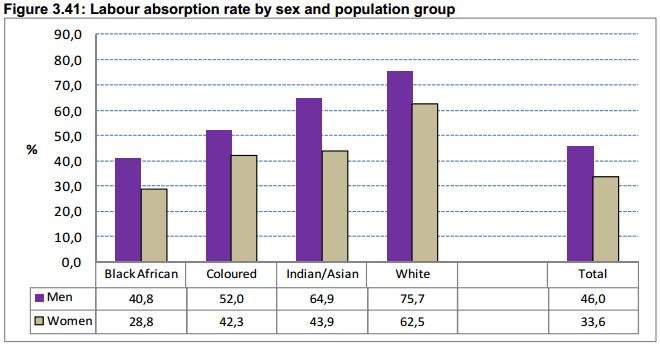
Figure 3.41 reflects a skewed distribution of employment opportunities among men and women by population group. The labour absorption rate among black African men was 40,8% compared with 75,7% among white men, while the LFPR among black African women was 28,8% compared with 62,5% among white women.
Figure 3.41 also shows that in terms of the other population groups, the labour absorption rate among men in the coloured population group was 52,0% and among women in that group it was 42,3%. Among the Indian/Asian population group, the absorption rate was 64,9% among men and 43,9% among women.
3.12.1.6 Key labour market rates by age group based on Census 2011
The analysis in this section shows that people in the youngest age groups face particular challenges in the South African labour market.
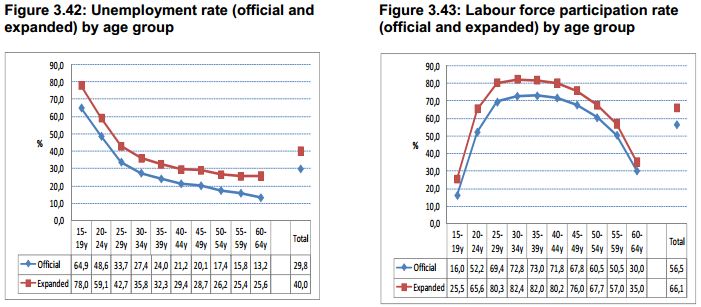
Unemployment rates generally decline with increasing age (Figure 3.42). In contrast, Figure 3.43 shows that the labour force participation rate has a different pattern. Based on both the official and expanded definition the labour force participation rate was lowest among the youngest and oldest age groups but highest in the prime working ages (25-54 years).
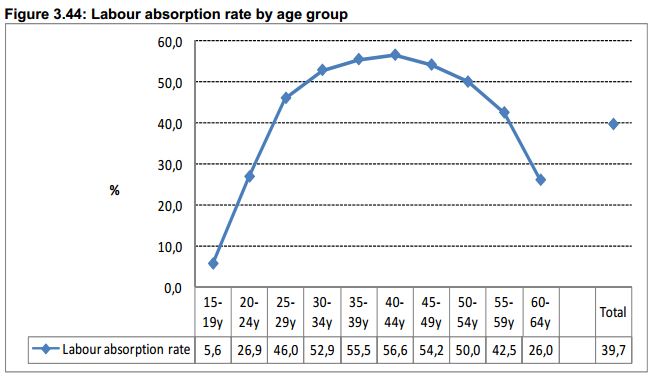
Figure 3.44 shows that the labour absorption rate was lowest among young people aged 15-19 years (5,6%) while among youth aged 20-24 years, the rate was 26,9%.
3.13 Conclusion
The specialised labour market surveys were introduced by Stats SA in the 1990s specifically for collecting ‘Official' labour market information regarding persons who are employed, those who are unemployed and those who are not economically active.
Although Census 2011 also included labour market questions, the results differ from those in the QLFS for two main reasons. Firstly, the reference period for employment in Census 2011 was one week while in the QLFS it covered a three-month period. Compared with Census 2011, the QLFS is therefore more likely to have captured individuals who worked on a casual/part-time basis.
Secondly, the Census used a de facto measure of the population while QLFS used a de jure measure. As a result, employed persons who were not in private households on Census night (e.g. persons who were in hotels or guest houses) were required to complete a shorter questionnaire which did not include labour market questions.
The comparison of Census 2011 national results with those of the QLFS_Q4:2011 suggest that the patterns of key labour market indicators based on population group, age, and sex are similar although the levels may sometimes be different. The Census 2011 results show that among the black African population, the unemployment rate (official and expanded) is higher than among the other groups, while among the white population group the unemployment rate is lowest. Census 2011 results also show that the unemployment rate among black African women is 41,2% based on the official definition and 52,9% based on the expanded definition.
In contrast, the unemployment rate among white women is 6,9% based on the official definition and 12,5% based on the expanded definition. With regard to the situation of young people in the South African labour market, the Census 2011 results show that the unemployment rate among youth aged 15-24 years is higher than in the older age groups.
The provincial comparisons of Census 2011 results with those of QLFS_Q4:2011 suggest that, based on both the official and the expanded definition, the difference in the unemployment rate between Census 2011 and QLFS_Q4:2011 is largest in KwaZulu-Natal, Eastern Cape and Limpopo. In these provinces, the informal sector accounts for a larger share of total employment compared to most of the other provinces, and this sector is known to generate short-term/casual jobs. The difference in the reference periods for employment in Census 2011 and the QLFS means that such jobs are more likely to have been captured in the QLFS than in Census 2011.
The full document can be accessed here - PDF.
Click here to sign up to receive our free daily headline email newsletter
