
Extract from Statistics South Africa, Census 2011: Statistical Release, October 30 2012
3.10 Average annual household income
Figure 3.25: Average annual household income by sex of head of household
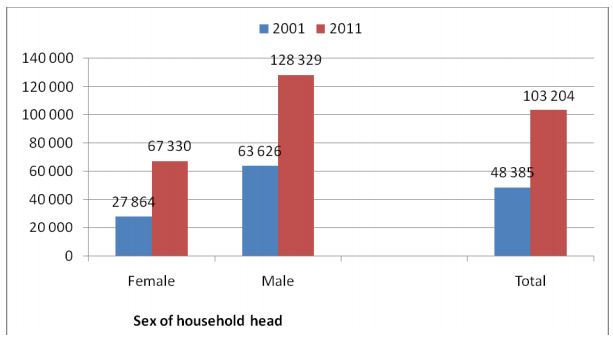
Census 2011 found that over the past ten years, the average annual household income for all households in South Africa more than doubled. It was up to R103 204 from R48 385 recorded in Census 2001. This represents an increase of 113,3% in nominal terms - the Consumer Price Index indicates that income should have increased by 77,5% during this period to have stayed in line with inflation.
Figure 3.25: shows that the average female-headed household had just more than half the annual income in 2011 of their male counterpart, (at R67 330) who earn an average of at least R128 329. However, the average femaleheaded household had increased their income by 141,6% from 2001 as compared with male-headed households that saw a relatively lower increase of 101,7%.
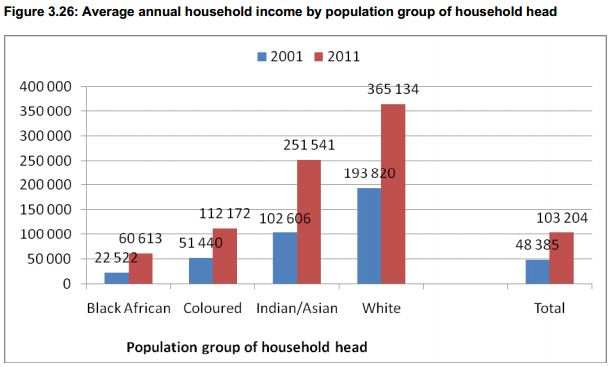
Figure 3.26: reflects the significant differences in average annual household income across the different population groups. Black African-headed households were found to have an average annual income of R60 613 in 2011.
Coloured-headed households had an average of R112 172 in 2011, while the figure for Indian/Asian-headed households stood at R251 541. White-headed households had the highest average household income at R365 134 per annum.
A comparison with the figures from 2001 does, however, show a bigger increase for black African-headed households of 169,1% as opposed to an 88,4% increase for white-headed households. Indian/Asian-headed households increased average income by 145,2% while coloured-headed households saw a 118,1% increase.
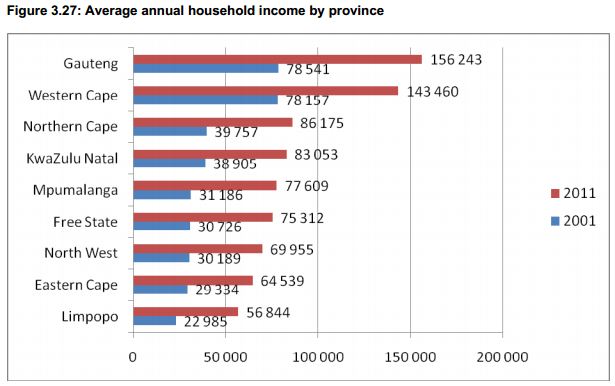
Census 2011 found that Limpopo remained the province with the lowest average annual household income at R56 844, followed by Eastern Cape where the average was R64 539. At the other end of the scale, Gauteng had the highest average annual household income at R156 243 followed by Western Cape with a figure of R143 460.
The order of provinces from 2001 to 2011 remained the same in terms of average annual household income. The five provinces with the lowest average annual household income in 2001 have seen the largest percentage increases during the period 2001 to 2011.
Households in Mpumalanga had the largest increase of 148,9% followed by those in Limpopo (147,3%), Free State (145,1%), North West (131,7%) and Eastern Cape (120,0%). In contrast, the average annual household income for households in Western Cape increased by 83,6% during this period and the increase in Gauteng was 98,9%.
The full document can be accessed here - PDF.
Click here to sign up to receive our free daily headline email newsletter
