
Adcorp Employment Index, July 2011
Salient features
- Employment declined at an annual rate of 0.4% during June, the third consecutive monthly decline. At an annual rate this represents a loss of 79,380 workers during the month, or 270,504 permanent and 18,180 temporary workers. (The balance is made up of unofficial jobs, which increased by 191,124 during July, reinforcing a trend that has been in evidence since January 2000.)
- Employment declined most sharply in the mining (7.7%) and manufacturing 8.6%) sectors, despite sharply rising export prices for commodities and basic beneficiated manufactured products.
- Government employment continued to rise (1.4%), with the public sector now accounting for all the job creation in the economy for 2011 as a whole.
- Our analysis of South African trade unions indicates that membership has declined from 4.3 million in 2000 to 3.2 million in 2010 - which trend is out of sync with the continuing surge in strikes and work stoppages reported so far this year. We estimate that, in 2011 and 2012, the South African economy will shed 468,192 jobs - or half as much again as was shed during the recent recession.
Adcorp Employment Index
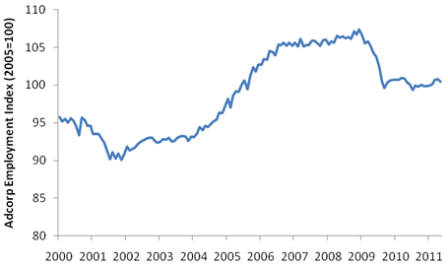
Source: Adcorp Holdings Limited
Analysis
The wave of strike actions in recent months suggests a trade union movement that is boundless in its political and economic power. In 2010, 14.6 million workdays were lost due to strikes and work stoppages, and Adcorp research suggests that in 2011 this figure will increase to 17.8 million - an increase of 22%.
Already strikes are significantly ahead of 2010 levels on a year-to-date basis and, worryingly, 68% of strikes have been in the private sector. In previous years, strike actions were largely restricted to the public sector. The unrest, conflict and violence associated with strikes in South Africa ranked 8th worst in the world in 2010, according to the World Economic Forum (WEF), the world's foremost business research foundation.
Yet an investigation of trade union membership presents a different picture. Neither Statistics SA nor the Department of Labour compiles detailed statistics on union membership, reflecting the complete disarray and growing irrelevance of these government bodies; and this makes estimation exceedingly difficult.
The problem is further compounded by the fact that, since official statistics came to an end, membership figures reported by Cosatu have suddenly and inexplicably begun to increase. Nonetheless, based on data available to us, union membership appears to have declined from 4.3 million to 3.2 million between 2000 and 2010 - a staggering decrease of 25.6%. Over the past decade the number of unionized workers, as a proportion of all workers, has declined from 35.6% (about 1 in 3) to 24.7% (about 1 in 4). This represents a loss of income to trade unions of approximately R82.5 million per month (R990 million per year).
The surge in strikes and labour unrest appears to be paradoxical when viewed against the decline in union membership. Possibly trade unions, battling for survival and under a crisis of relevance on the shop floor, are utilizing extra-workplace tactics to win membership and gain political influence. This is alarming, since the post-apartheid era - and, especially, one of the first laws passed by the ANC government, the Labour Relations Act of 1995 (LRA) - was intended to usher in a period of industrial peace.
Instead, levels of labour conflict and unrest are at the highest levels in South African history - including the wave of rolling mass action in the late 1980s, where workdays lost due to strikes never exceeded 10 million per year. Stated differently, in 2011 South Africa will have nearly double the number of strikes and/or workdays lost due to strikes as was the case at the height of apartheid in the late 1980s.
Yet the Department of Labour is applying severe pressure for organized business and organized labour to reach agreement on a new package of labour laws - encompassing affirmative action, temporary employment, union membership, and others - that will likely reduce South Africa's labour market efficiency by 16.5% in 2011 - this after a fall in 8.1% in 2010. Extrapolating these figures, by 2013 South Africa will rank the lowest-performing economy in the world in terms of labour market efficiency, as measured by the WEF.
Clearly this is an unsustainable path. Being in company with countries like Mali and Sudan does not bode well for the economy's ability to absorb more than 500,000 new job-seekers each year, let alone 8.5 million unemployed job-seekers. Indeed, this month's Adcorp Employment Index - which shows a marked decline in employment in the basic manufacturing and mining sectors, despite buoyant exports of commodities and related beneficiated products - suggests that South Africa's employment levels will continue to fall during 2011.
It is hard to gauge whether or when equilibrium might be attained. Certainly the LRA, which governs the entire collective bargaining process - both trade unions and, at least as important, bargaining councils - needs to be scrapped and re-developed from scratch. The Minister of Labour on 23 July threatened to side-step the Nedlac process if business and labour failed to reach agreement on the proposed labour laws, by indicating that the LRA allows for "extra-legal" procedures when agreement fails to be reached at Nedlac. Clearly government's tolerance for bargaining procedures is waning, which is no doubt a function of the lack of progress made through existing statutory processes.
Restrictive and increasingly obsolete labour laws suggest that employment will continue to slide. South Africa's post-2009 economic recovery is well established - with, for example, 2011 retail sales more than 20% higher than the pre-recession peak in 2008 - and yet this growth is of a jobless or even job-shedding kind. The trend is likely to continue through 2011 and 2012, and we anticipate that a further 362,000 jobs will be shed over this period.
Additional Data
Employment by Type
|
Occupation |
Employment Jul 2011 |
Percentage change vs. Jun 2010* |
|
Unofficial sector |
6,172,318 |
3.10 |
|
Official sector |
12,782,451 |
-2.11 |
|
Typical (permanent, full-time) |
8,962,319 |
-2.81 |
|
Atypical (temporary, part-time) |
3,820,132 |
-0.48 |
|
- of which agencies |
995,234 |
-0.94 |
|
Total |
18,954,769 |
-0.42 |
* Annualized
Employment by Sector
|
Sector |
Employment Jul 2011 (000s) |
Percentage change vs. Jun 2011* |
|
Mining |
311 |
-7.67 |
|
Manufacturing |
1,385 |
-8.60 |
|
Electricity, gas and water supply |
88 |
0.00 |
|
Construction |
525 |
6.90 |
|
Wholesale and retail trade |
1,637 |
1.47 |
|
Transport, storage and communication |
539 |
6.72 |
|
Financial intermediation, insurance, real estate and business services |
1,597 |
-1.50 |
|
Community, social and personal services |
2,619 |
1.38 |
* Annualized
Employment by Occupation
|
Occupation |
Employment Jul 2011(000s) |
Percentage change vs. Jun 2011* |
|
Legislators, senior officials and managers |
1,058 |
6.84 |
|
Professionals |
702 |
8.61 |
|
Technical and associate professionals |
1,593 |
1.51 |
|
Clerks |
1,441 |
0.83 |
|
Service workers and shop and market sales workers |
1,772 |
-0.68 |
|
Skilled agricultural and fishery workers |
100 |
-11.88 |
|
Craft and related trades workers |
1,421 |
-1.69 |
|
Plant and machine operators and assemblers |
1,009 |
-3.56 |
|
Elementary occupation |
2,368 |
-4.04 |
|
Domestic workers |
825 |
-5.79 |
* Annualized
Issued by Adcorp, August 10 2011
Click here to sign up to receive our free daily headline email newsletter
