
South Africa is a country with a notoriously dysfunctional school system. Up until quite recently however the sole criterion for publicly evaluating the success of government's educational policies was the annual matric pass rate. There has thus been an ever-pressing temptation for ministers of education at national and provincial level, and the officials and principals under them, to try and manipulate the results in an effort to secure increasing pass rates.
One of the ways this has traditionally been done is for schools to "cull" their weaker pupils before they reach matric, thereby inflating the pass rate. In a January 2012 paper Dr Stephen Taylor noted that one way one could control for this tendency - in evaluating trends in the matric pass rate - is by dividing the numbers of pupils passing matric in a given year by the number of Grade 10 pupils two years previously (see here - PDF).
In other words what is the "pass rate" when measured, not against the number of Grade 12 pupils who wrote the exam, but rather against the number of pupils in Grade 10 two years previously (before a whole lot of them dropped out the system)?
This is not, Taylor notes, a perfect measure as there are high levels of grade repetition in Grade 10, compared to earlier grades, "which causes a bulging of grade 10 enrolments." It is the trend then which is important, rather than the absolute figure.
What emerges then when one applies this form of measurement to the 2012 matric results?
The matric pass rate last year increased to 73.9% from 70.2% in 2011 (see Table 1). The ratio of successful government matriculants to Grade 10s in public schooling (two years prior) was 37.5% - up from 35.2% the year before (see Table 2). Thus the trend of an increasing matric pass rate holds, even if one uses 2010 Grade 10s, rather than just those who ultimately wrote the 2012 matric, as one's base.
Table 1: Trends in the matric pass rate nationally and by province (2008 to 2012)
|
2008 |
2009 |
2010 |
2011 |
2012 |
|
|
EASTERN CAPE |
50.6% |
51.0% |
58.3% |
58.1% |
61.6% |
|
FREE STATE |
71.6% |
69.4% |
70.7% |
75.7% |
81.1% |
|
GAUTENG |
76.3% |
71.8% |
78.6% |
81.1% |
83.9% |
|
KWAZULU-NATAL |
57.2% |
61.1% |
70.7% |
68.1% |
73.1% |
|
LIMPOPO |
54.7% |
48.9% |
57.9% |
63.9% |
66.9% |
|
MPUMALANGA |
51.7% |
47.9% |
56.8% |
64.8% |
70.0% |
|
NORTH WEST |
67.9% |
67.5% |
75.7% |
77.8% |
79.5% |
|
NORTHERN CAPE |
72.7% |
61.3% |
72.3% |
68.8% |
74.6% |
|
WESTERN CAPE |
78.7% |
75.7% |
76.8% |
82.9% |
82.8% |
|
NATIONAL |
62.2% |
60.6% |
67.8% |
70.2% |
73.9% |
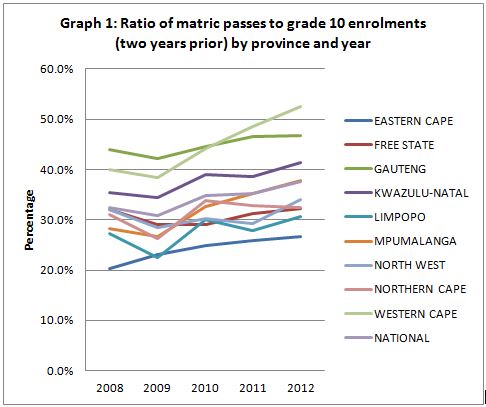
Table 2: Ratio of matric passes over Grade 10 enrolments (two years prior) by province and year
|
2008 |
2009 |
2010 |
2011 |
2012 |
|
|
EASTERN CAPE |
20.4% |
23.1% |
24.9% |
25.8% |
26.6% |
|
FREE STATE |
32.1% |
29.0% |
29.0% |
31.3% |
32.3% |
|
GAUTENG |
43.9% |
42.2% |
44.5% |
46.6% |
46.8% |
|
KWAZULU-NATAL |
35.4% |
34.4% |
39.1% |
38.5% |
41.3% |
|
LIMPOPO |
27.2% |
22.5% |
30.1% |
27.9% |
30.7% |
|
MPUMALANGA |
28.3% |
26.8% |
32.6% |
35.2% |
37.8% |
|
NORTH WEST |
32.1% |
28.5% |
30.3% |
29.3% |
34.1% |
|
NORTHERN CAPE |
31.1% |
26.3% |
33.9% |
32.9% |
32.4% |
|
WESTERN CAPE |
39.9% |
38.3% |
44.2% |
48.6% |
52.5% |
|
NATIONAL |
32.4% |
30.8% |
34.8% |
35.2% |
37.5% |
The more interesting comparison is between the provinces. Last year Gauteng (83.9%) overtook the Western Cape (82.8%) as the province with the highest matric pass rate. The Free State (81.1%) was the third best performing province, followed by the North West (79.5%).
However, if one measures the number of pupils passing matric in 2012 by province against the number of pupils in Grade 10 in 2010 then this ranking changes completely. The Western Cape (52.5%) performs by far the best on this measure, scoring almost twice as much as the worst performing province - the Eastern Cape (26.6%).
The Western Cape is followed by Gauteng (46.8%) and then KwaZulu-Natal (41.3%). The North West (34.1%) and Free State (32.3%) are ranked fifth and seventh respectively - suggesting that their matric pass rates may be being significantly inflated through culling.
Provincial trends in the ratio of successful matriculants to Grade 10s (two years prior), since the introduction of the new national senior certificate exam in 2008, are illustrated in Graph 1 below.
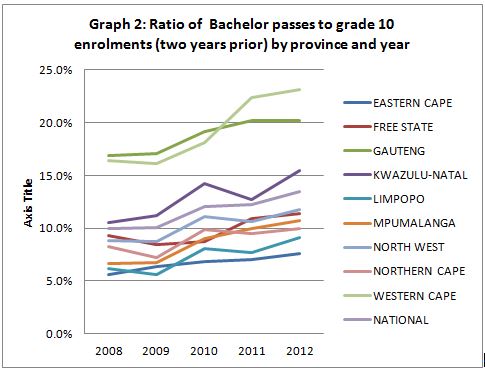
As is evident from the graph the Western Cape is the province which has shown the most significant improvement in percentage point terms since 2009. This applies to Bachelor's passes - the minimum pass needed in order to progress on to university - as well. The Western Cape overtook Gauteng in 2011 as the province with the highest ratio of Bachelor's Passes to Grade 10s (two years prior), and last year it extended this lead. See Table 3 and Graph 2 below.
Table 3: Ratio of Batchelor's passes to Grade 10 enrolments (two years prior) by province and year
|
|
2008 |
2009 |
2010 |
2011 |
2012 |
|
EASTERN CAPE |
5.6% |
6.3% |
6.8% |
7.0% |
7.6% |
|
FREE STATE |
9.3% |
8.5% |
8.7% |
10.9% |
11.4% |
|
GAUTENG |
16.9% |
17.1% |
19.2% |
20.2% |
20.2% |
|
KWAZULU-NATAL |
10.5% |
11.2% |
14.2% |
12.7% |
15.5% |
|
LIMPOPO |
6.2% |
5.6% |
8.1% |
7.7% |
9.1% |
|
MPUMALANGA |
6.6% |
6.8% |
9.0% |
10.0% |
10.7% |
|
NORTH WEST |
8.9% |
8.8% |
11.1% |
10.7% |
11.7% |
|
NORTHERN CAPE |
8.3% |
7.2% |
9.9% |
9.5% |
10.0% |
|
WESTERN CAPE |
16.4% |
16.1% |
18.1% |
22.3% |
23.2% |
|
NATIONAL |
10.0% |
10.1% |
12.1% |
12.2% |
13.5% |
This article was published with the assistance of the Friedrich-Naumann-Stiftung für die Freiheit (FNF). The views presented in the article are those of the author and do not necessarily represent the views of FNF.
Click here to sign up to receive our free daily headline email newsletter
