
Crime and punishment in contemporary South Africa IV – Estimating the performance of the system
2 June 2020
INTRODUCTION
This brief presents an estimate of the functioning of the criminal justice system as a whole for the five years from 2014/15 to 2018/19, based on the stick-flow model presented in the first brief in the series. The estimates are subject to the following limitations:
It is not possible to estimate the first part of the model, from crimes committed to crimes reported to the police. For that, one would have to rely on the VOCS data, and these are not available for all crimes. The insights from the VOCS data which do exist are set out in the second brief.
It is also not possible to estimate the last part of the model, from trial outcomes through sentencing and flows in and out of the correctional services system. This is because we lack sentencing data for those found guilty of crimes.
It is possible to estimate the central section of the model, from reported crimes to alternative dispute resolution and trial outcomes, and such estimation is the subject of this brief. Accurate estimation would require data on all relevant variables for all years, but the spottiness of the available data mean that parts of the estimation are based on only some of the five years under consideration. It follows that the estimation here is an approximation, though it turns out to be accurate enough to yield important insights.
It should be noted that the estimates here are period rather than cohort measures[1]. The model does not represent the experience of any actual cohort (say crimes reported to the police in 2014/15) but rather the experience of a hypothetical cohort successively exposed to the stages of the process as estimated over the entire five year period.
METHOD
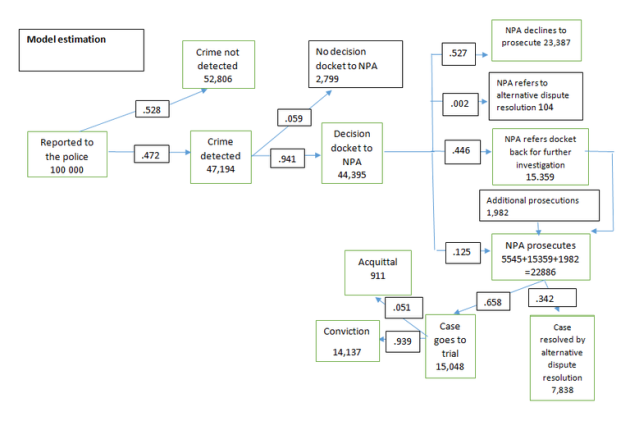
It is possible to estimate the model using only the transition probabilities from one stage of the process to the next. One starts with a given number of crimes reported to the police, here taken as 100,000. The model then represents what happens to each 100,000 reported crimes as the process proceeds. In the probability model presented below, the probabilities of transition are indicated in boxes within arrows representing transitions, and the number entering each stage in the process is entered in the box representing that stage. An example will make this clearer. Start with 100,000 reported crimes. The probability that they are detected is 48.0% (0.480) and the probability that they are not detected is 52.0% (0.520). Accordingly, 48,000 end up in the crime detected box and 52,000 end up in the crime not detected box. For crimes not detected, the matter ends there. However, the 48,000 detected crimes proceed to the next stage. The probability that a detected crime results in a docket being presented to the NPA for decision is 94.1% (0.941), so the number of dockets presented to the NPA is 0.941 x 48,000 = 45,168 and the number of detected crimes which do not end up in a dockets presented is 0.059 x 48,000 = 2,832. And so on, through all the stages of the process.
The main problem in estimating the model lies in the transition from the disposition of dockets to cases finalized. If one adds the number of prosecutions which proceed on the basis of dockets as first received to prosecutions which proceed on the basis of dockets referred back for further investigation, the subtotal is smaller than the number of cases finalized. This is dealt with in the model by the device of adding ‘additional prosecutions’ to reconcile prosecutions with cases finalized. The additional number required is not large (8.7% of cases finalized), but it blurs the picture slightly.
One may then add up the numbers ending up in destination boxes (boxes into which there is entry, but from which there is no exit. Table 1 sets out the calculation.
Table 1
|
Destination |
Per cent of crimes reported |
|
Crime not detected |
52.8 |
|
Crime detected, but no docket to NPA |
2.8 |
|
Docket to NPA, NPA declines to prosecute |
23.4 |
|
NPA refers case to alternative dispute resolution |
0.1 |
|
Court refers case to alternative dispute resolution |
7.8 |
|
Trial resulting in conviction |
14.1 |
|
Trial resulting in acquittal |
0.9 |
|
Total |
102.0 |
Without the additional prosecutions entry, the total would be 100.0%, with it, the total rises to 102.0%. Just 14% of reported crimes end in a conviction, and a further 8% in alternative dispute resolution.
Table 1 shows clearly that the binding constraint on performance is police detection capacity at two levels: firstly, identification of culprits and secondly, even when accused are identified, the inability of prosecutors to construct a prima facie case from dockets submitted to them. In broad terms, the NPA is functioning efficiently: dockets received are virtually all processed, and there is a high degree of success in prosecutions. This does not mean that there are not NPA constraints when it comes to particular categories of crime, a point which will be discussed further (along with other remarks) in the next, and final brief in this series.
By Charles Simkins, Head of Research, HSF, 2 June 2020
[1] For an explanation of the difference between period and cohort measures, please refer to the relevant paragraph in the first brief
