Who Voted For The Economic Freedom Fighters In The 2014 National Election?
This Brief sets out voter geographical information derived from the voting patterns as observed in the 2014 National Election.
Whom do the Economic Freedom Fighters represent? A survey-derived full data set of individuals which records political affiliation along with socioeconomic variables would be invaluable. But if such information exists, it is not publicly available.
However, at the local government ward level, there are two generally available sources of information:
1. The results of the 2014 national election, published by the Independent Electoral Commission.
2. The results of the 2011 census. The variables of interest in it change relatively slowly, so that they can be used with reasonable confidence alongside the election results, despite the three year difference in dates.
It turns out that one can learn quite a bit from these data sets, though not everything that a survey could reveal.
Spatial distribution of EFF support
First, it is possible to draw a map of the extent of EFF support by ward. The colour coding is:
|
Colour |
EFF share of the vote |
|
Darkest purple |
More than 15% of valid votes |
|
Middle purple |
Between 10% and 15% |
|
Lightest purple |
Between 5% and 10% |
|
No colour |
Less than 5% |
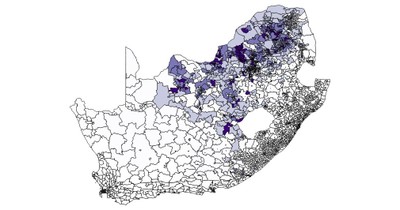
The map shows large interprovincial differentials in support:
|
Province |
Number of votes |
Sharing of provincial votes |
|
|
|
|
|
Gauteng |
451 318 |
10.30 |
|
Limpopo |
156 982 |
10.74 |
|
North West |
143 675 |
13.12 |
|
Mpumalanga |
83 589 |
6.26 |
|
Free State |
82 674 |
8.15 |
|
Eastern Cape |
75 776 |
3.48 |
|
KwaZulu-Natal |
70 823 |
1.85 |
|
Western Cape |
44 762 |
2.11 |
|
Northern Cape |
20 951 |
4.96 |
|
Total |
1 169 259 |
6.35 |
The representation is wide spread in North West, Limpopo, Gauteng and Free State. It is patchy in Mpumalanga and Northern Cape, and very low in Eastern Cape, Western Cape and KwaZulu-Natal. The EFF is a northern party.
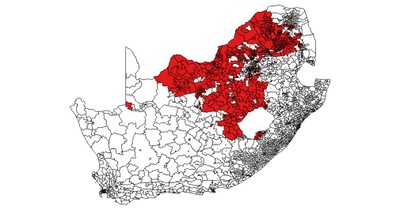
It is also linguistically based. The map below shows wards in which Sepedi (Northern Sotho), Setswana (Western Sotho) and Sesotho (Southern Sotho) first language speakers together comprise more than 50% of the population:
Socio-economic correlates in the four core support province
Further insight can be gained by analyzing conditions in the four core support provinces. Support by settlement type is as follows:
|
More than 50% of the population in |
EFF support |
Number of wards |
|
Formal residential |
9.6% |
966 |
|
Informal residential |
13.1% |
30 |
|
Tribal/traditional |
10.9% |
639 |
|
Farms |
7.5% |
39 |
Age is the key variable about which the data can deliver no conclusions. The EFF gives the impression of being a young person’s party. Its leader was a former president of the ANC Youth League, and its representatives in parliament are mostly young. But appearances can be deceptive and, in any case, the extent of a bias towards youth cannot be established.
We do have information on average years of education, the proportion of employed among the economically active, and median[1] individual monthly income by wards from the census. Bear in mind (a) that the monthly incomes are for 2011, and (b) as medians of the distribution by recipient (not limited to the employed), they are below the average individual income. The table below sets out the information:
Simple averages across wards
|
EFF support |
Average years of education |
Average per cent employed |
||||||
|
|
20-34 |
35-59 |
20-59 |
20-34 |
35-59 |
20-59 |
||
|
|
|
|
|
|
|
|
||
|
More than 15% |
11 |
9.8 |
10.5 |
52 |
70 |
61 |
||
|
10-15% |
10.7 |
9.3 |
10.1 |
44 |
63 |
53 |
||
|
5-10% |
10.6 |
9.2 |
10.0 |
48 |
65 |
56 |
||
|
Less than 5% |
10.6 |
9.2 |
10.0 |
48 |
65 |
56 |
||
|
|
|
|
|
|
|
|
||
|
All |
10.8 |
9.6 |
10.3 |
51 |
68 |
59 |
||
***
|
EFF support |
Median monthly income |
|||
|
|
20-34 |
35-59 |
20-59 |
|
|
|
|
|
|
|
|
More than 15% |
1630 |
2250 |
1980 |
|
|
10-15% |
1150 |
1470 |
1320 |
|
|
5-10% |
1140 |
1470 |
1260 |
|
|
Less than 5% |
1980 |
3050 |
2550 |
|
|
|
|
|
|
|
|
All |
1350 |
1830 |
1580 |
|
The table indicates:
1. The wards in which the EFF has least support have the highest values of each of the variables, suggesting that the EFF has low appeal in the most affluent areas.
2. It is not correct to regard the EFF as simply enjoying most support among the poor. Indeed, the average levels of the variables among the wards showing most support for the EFF are second only to those showing the least support. The middle two support categories have levels slightly below average.
These results have to be interpreted in the light of spatial correlation, i.e the tendency of the level of support in one ward to depend on the support in neighbouring wards. Particularly in light of the fact that the EFF was a new party in 2014, one would expect there to be focal areas of organization. These areas can be defined in geographical terms as follows:
North West: A belt running north west from Marikana to the border, a belt centred on Mmabatho and extending north and west along the Botswana border, a belt from Schweizer-Reneke extending north west along the provincial boundary and an isolated node centred on Klerksdorp.
Limpopo: A belt running north west to south east centred on Seshego and a belt running north east to south west from Bochum to the border, with an isolated node around Ellisras.
Gauteng: A belt running along the western border from Mabopane to Diepsloot, then east to Midrand and south to Kempton Park and Alexandra, parts of Soweto and the Ekurhuleni townships, and a belt stretching south from Carletonville.
Free State: A belt running more or less south and north, centred on the Gold Fields, a U-shaped belt running along the Lesotho border from Ladybrand south and then veering across to Thaba Nchu and Botshabel, with a southern arm centred on Wepener.
What does this mean for the future?
1. It may be that the EFF starts to decline as COPE did. On the other hand, the EFF has so far avoided a disabling leadership fight, which helped to disable COPE.
2.The EFF did well to secure 25 parliamentary seats in its first election. If its grass roots mobilization expands, it can expect to deepen and extend geographically zones of support.
3. The EFF projects a radical programme. Its parliamentary performance, however, has centred on implacable hostility to the president and to the deputy president. This hostility is symbolically salient: the ‘not us’ patronage, the ‘not us’ wealth. It is short on concrete political proposals, but in a system based on patronage and rent allocation, this may not matter too much when it comes it mobilizing support.
4. It does not seem coincidental that the support for the EFF coincides geographically in great measure with areas in which the Sotho (broadly speaking) are in a majority. Apart from the brief tenure of Kgalema Motlanthe, the president has been Xhosa or Zulu since 1994. A feeling of being left out among EFF supporters would not be surprising. In hard times, it may spread beyond the 2014 linguistic boundaries.
Charles Simkins is Senior Researcher at the Helen Suzman Foundation.
This article first appeared as an HSF Brief.
Footnote:
[1] The median is the observation in the middle. Half of the recipients receive more than the median, and half less.
