
Adcorp Employment Index, January 2011
Salient features
- The economy created 80,000 jobs in January, representing annualized growth of 5.0% over the previous month. Nonetheless, the economy is still 420,000 jobs short of the peak employment level observed prior to the 2009 global financial crisis.
- All employment contract types reported gains in employment, notably temporary work (+7.1%) and agency work (+8.0%). Temporary work now represents 3.87 million workers or 30.1% of the workforce.
- All sectors of the economy reported gains in employment, notably wholesale and retail trade (+13.6%), transport and logistics (+8.8%) and government (+3.1%).
- All occupational categories reported growth in employment, but high-skilled categories (management and professionals) reported the strongest growth (+4.7%), reflecting the economy's ongoing reorientation toward high-skilled positions. Clerks, service workers and sales and marketing staff reported strong growth (+8.0%), reflecting the relative economic buoyancy of the consumer sectors of the economy.
- This month, we look at two notable personal income trends: rising real incomes and narrowing racial income disparities.
Adcorp Employment Index
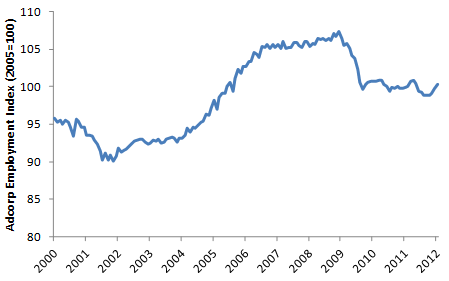
Source: Adcorp Analytics (2012)
Analysis
Over the past decade, two important personal income trends have emerged in South Africa. Firstly, after-inflation incomes have risen sharply, from R44 431 per year in 2000 to R61 645 per year in 2011 - a real increase of 39%, or a respectable 3.3% per year. Secondly, income inequality between the races, especially between blacks and whites, has declined sharply. In 2000, the average black South African earned 15% of the average white South African's income, whereas in 2011, a typical black person earned 40% of a typical white person's income. Currently 1.3 million blacks (or 14% of the black workforce) earn as much as or more than the average white, up from 270,000 in 2000 - an increase of more than 1 million, or 378% (see figure).
Number of high-income black South Africans, 2000-2011
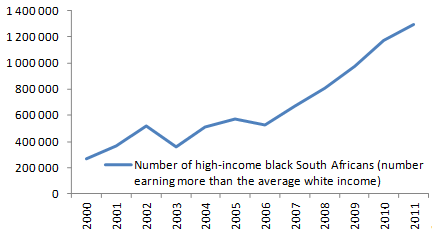
Sources: Adcorp Analytics, Statistics South Africa (2011)
To a great extent, the improvement in black incomes has been associated with the civil service. Over the past decade, government employment has increased from 1 million to 1.24 million, and the proportion of blacks in the civil service has increased from 42% to 74%. As a result, nearly 40% of South Africa's highest-earning blacks are employees of the South African government. Partly this is associated with trade unionization: currently 70% of the public sector workforce belongs to a trade union, compared to 26% for the private sector.
More significantly, the sharp increase in black civil servants' incomes is associated with "managerial bloat": officially, government wages have increased by just 5.4% per annum, but the government has utilized the twin mechanisms of promotion and job re-grading (which are not subject to public sector wage agreements) to increase the income of black civil servants, with the result that average remuneration for public sector workers is now 32% higher than that of private sector workers.
At present, compensation of employees represents nearly 90% of total government spending. Clearly, strategic use of the government payroll has been a major contributor to the emerging black middle class in South Africa.
Nonetheless, three in five of South Africa's highest-earning blacks are employed in the private sector - numbering around 820 000 at present. If the historical rate of progression is maintained, by 2020 there will be 5.1 million blacks earning more than the average white in private business enterprises. At this rate, the income gap will close in less than 10 years: the average white person's income is currently rising by 5.3% per annum, whereas the average black person's income is rising by 14.9% per annum (see figure).
These figures, which suggest that racial disparities in the private sector are closing relatively quickly, do not tally with the employment equity figures presented by the Department of Labour, with the important implication that the government's figures - which narrowly emphasise racial quotas in managerial positions - are missing a dramatic pattern of improvement in the labour market.
Income disparities between the races (black vs. white), 2000-2011
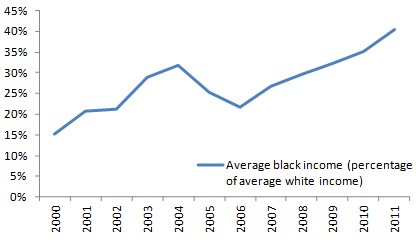
Source: Adcorp Analytics, Statistics South Africa (2011)
The government can do several things to accelerate this process. Firstly, the most important single impediment to rising incomes and narrowing inequality is the public education system. No government function does more to perpetuate racial disparities than the poor standard of secondary education, which by reducing (mostly black) learner options for education and skills, reduces their prospects for employment.
Secondly, labour laws are in need of review and targeted relaxation, notably the two laws that diminish job creation by small businesses, namely dismissal protections and automatic extensions of collective bargaining agreements. Thirdly, government's inefficient and bureaucratic immigration controls, which prevent high-skilled foreigners from imparting their skills and experience to local workplaces, have artificially boosted incomes of high-skilled workers.
The implication is that government policies - notably secondary schooling, restrictive labour laws and immigration controls - have been holding black incomes back. Without these counterproductive policies, blacks' incomes would probably be rising even faster relative to whites', and the income gap would be falling even faster.
Additional Data
Employment by Type
|
Occupation |
Employment Jan 2012 |
Percentage change vs. Dec 2011* |
|
Unofficial sector |
6,276,511 |
3.10 |
|
Official sector |
12,923,339 |
5.95 |
|
Typical (permanent, full-time) |
9,029,024 |
5.44 |
|
Atypical (temporary, part-time) |
3,894,315 |
7.15 |
|
- of which agencies |
1,010,527 |
8.00 |
|
Total |
19,199,850 |
5.02 |
* Annualized
Employment by Sector
|
Sector |
Employment Jan 2012 (000s) |
Percentage change vs. Dec 2011* |
|
Mining |
304 |
3.96 |
|
Manufacturing |
1,341 |
2.69 |
|
Electricity, gas and water supply |
90 |
27.27 |
|
Construction |
511 |
-4.68 |
|
Wholesale and retail trade |
1,699 |
13.57 |
|
Transport, storage and communication |
550 |
8.79 |
|
Financial intermediation, insurance, real estate and business services |
1,642 |
2.20 |
|
Community, social and personal services |
2,680 |
3.14 |
* Annualized
Employment by Occupation
|
Occupation |
Employment Jan 2012 (000s) |
Percentage change vs. Dec 2011* |
|
Legislators, senior officials and managers |
1,079 |
2.23 |
|
Professionals |
717 |
8.43 |
|
Technical and associate professionals |
1,609 |
3.74 |
|
Clerks |
1,492 |
8.10 |
|
Service workers and shop and market sales workers |
1,829 |
7.93 |
|
Skilled agricultural and fishery workers |
99 |
12.24 |
|
Craft and related trades workers |
1,418 |
6.81 |
|
Plant and machine operators and assemblers |
1,001 |
3.61 |
|
Elementary occupation |
2,369 |
2.03 |
|
Domestic workers |
847 |
2.84 |
* Annualized
Statement issued by Adcorp, February 13 2012
Click here to sign up to receive our free daily headline email newsletter
