
Adcorp Employment Index, August 2011
Salient features
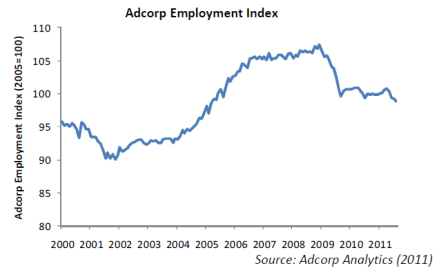
- Employment declined at an annual rate of 2.1% during August, the fourth consecutive monthly decline. At an annual rate this represents a loss of 49,306 workers during the month.
- Employment declined most sharply in the manufacturing (19.9%), mining (19.3%) and construction (16.0%) sectors, despite sharply rising export prices for commodities and basic beneficiated manufactured products. In line with the declines in the manufacturing and mining sectors, employment of machine operators declined by 5.95% and of technical professionals by 3.8%.
- Employment by government continued to rise (6.2%), with the public sector now accounting for all the job creation in the economy for 2011 as a whole.
- The unofficial sector continued to create jobs, employing 16,917 additional people in August, contributing to the so-called "informalization" of the South African workforce.
- This month we take a closer look at temporary work, for the reason that temporary work bears a close relationship to the economy's underlying health and may be considered a leading indicator of permanent employment conditions. Permanent jobs, which are beset by legal and regulatory problems as our previous analysis has shown, are an unreliable indicator of business activity. In August the capacity utilization of temp staff (i.e. the number of hours actually worked in relation to the available hours per temp) dropped to 74.6% - a decline of 8.1% at an annual rate, the worst decline in 4 months. Compared to a year ago, the number of temps increased by 4.5% in August but their average monthly working hours declined by 20.6%. Overall, capacity utilization of temps dropped by 9.0% in August compared to a year ago and by 24.1% compared to the peak in April this year. This suggests that employment conditions remain exceedingly weak and continues to suggest that the prospect of an improvement in permanent jobs, which tend to lag behind temp jobs, is a long way off.
Analysis
Considerable uncertainty surrounds the current condition of the South African economy. According to Statistics SA, mining and manufacturing figures for July indicate a decisive slowdown in production levels, suggesting that global economic weakness continues to affect South African producers adversely. However, Investec's Hard Numbers Index produced by Prof Brian Kantor suggests that the consumer - as measured by domestic vehicle sales and the demand for bank notes - is generally buoyant, while liquidations and insolvencies continue to improve suggesting that consumer indebtedness and small business earnings are improving.
Employment levels are not usually viewed as a barometer of economic conditions, for the reason that job creation tends to lag behind improvements in the economy, usually by between 24 and 36 months. Permanent jobs, which represent 47.3% of all jobs in South Africa, have the property that many economic conditions must be met - sustained high economic growth, high and stable returns on capital, buoyant business and consumer confidence, certainty around government policies, etc. - before employers will venture to risk employing someone on an indefinite basis.
This is not to say that permanent work is secure or indefinite. All workers - temporary workers, agency workers, permanent workers, etc. - are equally protected by labour legislation in South Africa. But section 189 of the Labour Relations Act (1995) permits an employer to dismiss an employee on the basis of operational requirements, termed "retrenchment", the conditions for which are most easily demonstrated in the case of temporary and agency ("labour broker") workers.
This makes temporary work much more flexible than permanent work in practice, since the employer typically does not create an expectation of indefinite employment when engaging a temporary worker. The upshot is that temporary work follows economic activity fairly closely (correlation = 79.3%), since employers are able to use contract workers for fixed, typically short, durations on an as-needed basis.
The advantages of employment flexibility - such as matching labour costs to variable production and sales volumes, and limiting employment to the duration of a project or specific investment programme - have given rise to a systematic upward growth path in temporary employment, which now represents 29.9% of total official employment.
This would ordinarily make interpreting temporary employment growth difficult to interpret in relation to the economy, but several data transformations are possible that give great meaning to temporary employment data. For example, the capacity utilization of temporary workers is defined as the number of hours actually worked in relation to the available hours per temp.
When an individual temp's capacity utilization approaches or occasionally exceeds 100%, it will usually be followed by the employment of additional temps. When the capacity utilization of all temps across the country approaches 100%, it will usually be followed, either by the creation of more temporary positions, or by the use of permanent workers.
As indicated in the figure below, capacity utilization of temporary workers increased during the period January to December 2010, as the South African economy grew following the 2008/2009 recession. In January and February 2011, there was a brief lull in temp capacity utilization, followed by resumed momentum during March and April. Of greater interest is the pattern in the last four months - namely a decline in temps' capacity utilization from 98.3% in April to 74.6% in August, or the lowest level since February.
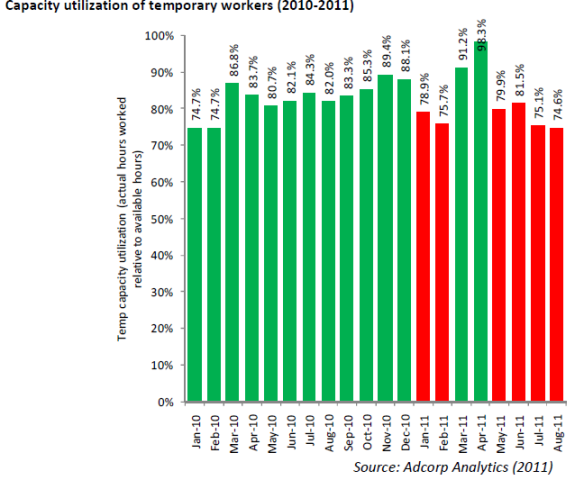
Compared to a year ago, the number of temps increased by 4.5% in August but their average monthly working hours declined by 20.6%. Overall, capacity utilization of temps dropped by 9.0% in August compared to a year ago and by 24.1% compared to the peak in April this year. This suggests that employment conditions remain exceedingly weak and continues to suggest that the prospect of an improvement in permanent jobs, which tend to lag behind temp jobs, is a long way off.
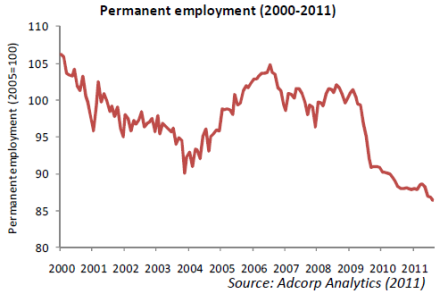
It is possible that temp capacity utilization is declining for non-economic reasons, due mainly to impending labour legislation that will make it more difficult to hire employees on a temporary basis. Nonetheless, the chart gives some credence to the "double-dip" theory that has emerged in recent months - i.e. a view that the South African economy is facing a further recession. To put this in context, as indicated in the figure below permanent employment has now declined by 7.2% or 989,239 jobs since the beginning of the 2008/2009 recession - including 100,087 jobs lost since the economy began to recover in the post-recession period.
Additional Data
Employment by Type
|
Occupation |
Employment Aug 2011 |
Percentage change vs. Jul 2011* |
|
Unofficial sector |
6,189,235 |
3.29 |
|
Official sector |
12,733,145 |
-4.63 |
|
Typical (permanent, full-time) |
8,922,231 |
-5.37 |
|
Atypical (temporary, part-time) |
3,810,914 |
-2.90 |
|
- of which agencies |
994,697 |
-0.65 |
|
Total |
18,922,380 |
-2.05 |
* Annualized
Employment by Sector
|
Sector |
Employment Aug 2011 (000s) |
Percentage change vs. Jul 2011* |
|
Mining |
306 |
-19.29 |
|
Manufacturing |
1,362 |
-19.93 |
|
Electricity, gas and water supply |
89 |
13.64 |
|
Construction |
518 |
-16.00 |
|
Wholesale and retail trade |
1,642 |
3.67 |
|
Transport, storage and communication |
536 |
-6.68 |
|
Financial intermediation, insurance, real estate and business services |
1,601 |
3.01 |
|
Community, social and personal services |
2,632 |
5.96 |
* Annualized
Employment by Occupation
|
Occupation |
Employment Aug 2011 (000s) |
Percentage change vs. Jul 2011* |
|
Legislators, senior officials and managers |
1,059 |
1.13 |
|
Professionals |
704 |
3.42 |
|
Technical and associate professionals |
1,588 |
-3.77 |
|
Clerks |
1,442 |
0.83 |
|
Service workers and shop and market sales workers |
1,773 |
0.68 |
|
Skilled agricultural and fishery workers |
99 |
-12.00 |
|
Craft and related trades workers |
1,418 |
-2.53 |
|
Plant and machine operators and assemblers |
1,004 |
-5.95 |
|
Elementary occupation |
2,360 |
-4.05 |
|
Domestic workers |
821 |
-5.82 |
* Annualized
Issued by Adcorp, September 12 2011
Click here to sign up to receive our free daily headline email newsletter
