
The Commission for Employment Equity published the 11th CEE Annual Report on Wednesday. Employers were required to submit reports in August 2010 which had to include data on the race, gender and disability profile of their workforces. 18,534 reports were received of which 16,698 were analysed - covering 5,280,037 employees. The tables below are derived from the report. They give a breakdown by race and occupational level, of 'government' employees, 'private sector' employees and 'all' employees.
|
Table 1: Government employees by race and occupational level |
||||||
|
|
Black |
Coloured |
Indian |
White |
Foreign National |
Total |
|
Top Management |
1,543 |
237 |
119 |
403 |
15 |
2,317 |
|
66.6% |
10.2% |
5.1% |
17.4% |
0.6% |
100.0% |
|
|
Senior Management |
6,247 |
863 |
714 |
2,921 |
78 |
10,823 |
|
57.7% |
8.0% |
6.6% |
27.0% |
0.7% |
100.0% |
|
|
Professionally qualified and experienced specialists and mid-management |
55,442 |
13,458 |
4,439 |
19,613 |
1,153 |
94,105 |
|
58.9% |
14.3% |
4.7% |
20.8% |
1.2% |
100.0% |
|
|
Skilled technical and academically qualified workers, junior management, supervisors, foremen, and superintendents |
300,458 |
48,602 |
11,135 |
57,876 |
1,741 |
419,812 |
|
71.6% |
11.6% |
2.7% |
13.8% |
0.4% |
100.0% |
|
|
Semi-skilled and discretionary decision making |
243,736 |
40,230 |
6,988 |
13,716 |
411 |
305,081 |
|
79.9% |
13.2% |
2.3% |
4.5% |
0.1% |
100.0% |
|
|
Unskilled and defined decision making |
100,345 |
16,734 |
1,260 |
1,184 |
88 |
119,611 |
|
83.9% |
14.0% |
1.1% |
1.0% |
0.1% |
100.0% |
|
|
Temporary employees |
44,199 |
5,480 |
725 |
4,320 |
992 |
55,716 |
|
79.3% |
9.8% |
1.3% |
7.8% |
1.8% |
100.0% |
|
|
Total |
751,970 |
125,604 |
25,380 |
100,033 |
4,478 |
1,007,465 |
|
74.6% |
12.5% |
2.5% |
9.9% |
0.4% |
100.0% |
|
|
Table 2: Private sector employees by race and occupational level |
||||||
|
|
Black |
Coloured |
Indian |
White |
Foreign National |
Total |
|
Top |
3,845 |
1,698 |
2,753 |
30,608 |
1,208 |
40,112 |
|
9.6% |
4.2% |
6.9% |
76.3% |
3.0% |
100.0% |
|
|
Senior |
10,967 |
5,960 |
8,170 |
59,848 |
2,199 |
87,144 |
|
12.6% |
6.8% |
9.4% |
68.7% |
2.5% |
100.0% |
|
|
Professionally qualified and experienced specialists and mid- management |
64,384 |
26,671 |
29,696 |
164,887 |
6,739 |
292,377 |
|
22.0% |
9.1% |
10.2% |
56.4% |
2.3% |
100.0% |
|
|
Skilled technical and academically qualified workers, junior management, supervisors, foremen, and superintendents |
365,074 |
120,622 |
69,806 |
314,154 |
15,028 |
884,684 |
|
41.3% |
13.6% |
7.9% |
35.5% |
1.7% |
100.0% |
|
|
Semi-skilled and discretionary decision making |
1,099,528 |
210,425 |
62,008 |
145,050 |
54,685 |
1,571,696 |
|
70.0% |
13.4% |
3.9% |
9.2% |
3.5% |
100.0% |
|
|
Unskilled and defined decision making |
701,475 |
93,105 |
7,997 |
11,179 |
37,046 |
850,802 |
|
82.4% |
10.9% |
0.9% |
1.3% |
4.4% |
100.0% |
|
|
Temporary employees |
398,670 |
69,884 |
18,308 |
48,480 |
10,415 |
545,757 |
|
73.0% |
12.8% |
3.4% |
8.9% |
1.9% |
100.0% |
|
|
Total |
2,643,943 |
528,365 |
198,738 |
774,206 |
127,320 |
4,272,572 |
|
61.9% |
12.4% |
4.7% |
18.1% |
3.0% |
100.0% |
|
|
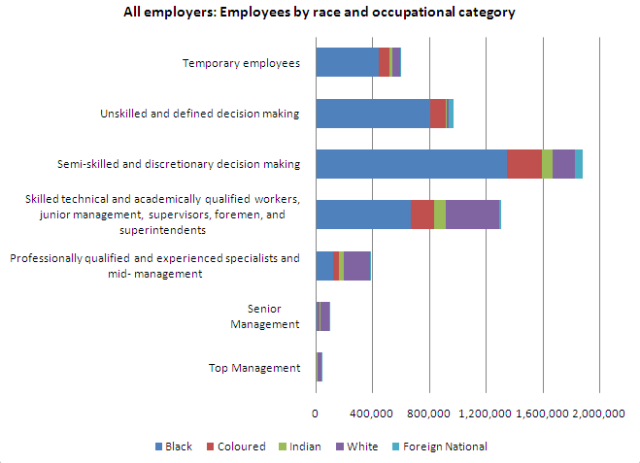
Table 3: All (private sector + govt) employees by occupational level and race |
||||||
|
Black |
Coloured |
Indian |
White |
Foreign National |
Total |
|
|
Top Management |
5,388 |
1,935 |
2,872 |
31,011 |
1,223 |
42,429 |
|
12.7% |
4.6% |
6.8% |
73.1% |
2.9% |
100.0% |
|
|
Senior |
17,214 |
6,823 |
8,884 |
62,769 |
2,277 |
97,967 |
|
17.6% |
7.0% |
9.1% |
64.1% |
2.3% |
100.0% |
|
|
Professionally qualified and experienced specialists and mid- management |
119,826 |
40,129 |
34,135 |
184,500 |
7,892 |
386,482 |
|
31.0% |
10.4% |
8.8% |
47.7% |
2.0% |
100.0% |
|
|
Skilled technical and academically qualified workers, junior management, supervisors, foremen, and superintendents |
665,532 |
169,224 |
80,941 |
372,030 |
16,769 |
1,304,496 |
|
51.0% |
13.0% |
6.2% |
28.5% |
1.3% |
100.0% |
|
|
Semi-skilled and discretionary decision making |
1,343,264 |
250,655 |
68,996 |
158,766 |
55,096 |
1,876,777 |
|
71.6% |
13.4% |
3.7% |
8.5% |
2.9% |
100.0% |
|
|
Unskilled and defined decision making |
801,820 |
109,839 |
9,257 |
12,363 |
37,134 |
970,413 |
|
82.6% |
11.3% |
1.0% |
1.3% |
3.8% |
100.0% |
|
|
Temporary employees |
442,869 |
75,364 |
19,033 |
52,800 |
11,407 |
601,473 |
|
73.6% |
12.5% |
3.2% |
8.8% |
1.9% |
100.0% |
|
|
Total |
3,395,913 |
653,969 |
224,118 |
874,239 |
131,798 |
5,280,037 |
|
64.3% |
12.4% |
4.2% |
16.6% |
2.5% |
100.0% |
|
Data source: Commission for Employment Equity, 11th CEE Annual Report, August 3 2011
Click here to sign up to receive our free daily headline email newsletter
