
Adcorp Employment Index, December 2011
Salient features
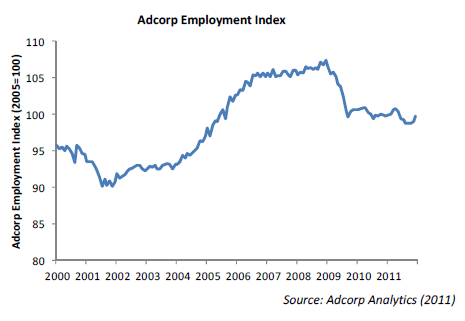
- Employment grew at an annual rate of 6.5% in December, representing 103,327 new jobs, the fastest rate of growth in nine months. All employment categories reported growth, the fastest being temporary work (+15.1%) and permanent jobs (+6.2%). Agency work lagged behind at +4.8%, possibly reflecting legislative and regulatory uncertainties regarding labour broking.
- The number of jobs in South Africa is still 850,000 below the peak reached before the 2009 recession. Since the recession, the economy has shed 1.56 million permanent jobs and created 0.71 million temporary jobs.
- Significant job growth was recorded in the distribution and logistics sector (+15.6%) and the financial services (+8.9%) and retail (+7.9%) sectors. No sectors reported a decline in employment.
- Job growth was fastest among low-skilled and semi-skilled job categories, notably service workers (+10.7%), clerks (+9.8%) and elementary occupations (+8.2%). This is the first time since the 2009 recession that employment growth has been observed in the entry-level occupations.
- This month we take a closer look at the supply of labour and several factors which influence the desire to work.
Analysis
Recent commentary on the South African labour market has generally focused on the demand for labour. This is understandable, since South Africa's high unemployment rate has been characterized as a demand-side problem, to be solved by improving the incentives for employers to hire. Yet the supply of labour is equally important, since it determines whether workers wish to work at prevailing wage rates. In this article we examine recent developments affecting the desire to work.
Government handouts have had a marked negative effect on the desire to work. Grants in South Africa amount to approximately R1,150 per month (child support grants amount to R260 per child per month), and the means-tested upper annual income threshold varies from R31,000 per person (in the case of child support) to R752,400 per person (in the case of older persons). 10.2 million South Africans - approximately 1 in 5 - receive grants of one form or another, amounting to 14.9 million grants or 1.5 grants per recipient, yielding average transfers of R9,539 per beneficiary per annum.
Statistics SA's Quarterly Labour Force Survey provides startling confirmation of these effects. As indicated in the table, 43.3% of unemployed people are willing to accept a job, if offered, when they are supported by their own savings, whereas 11.1% of people will accept a job if they are supported by social grants and welfare. Unemployed people are also more likely to remain out of work if they are supported by social grants and welfare: the average duration of unemployment is 16 months for people who do not receive grants, compared to 21 months for people who do.
|
Percent who are willing to accept a job if offered |
|
|
Supported by social grants and welfare |
11.1% |
|
Supported by unemployment insurance |
35.2% |
|
Supported by own savings |
43.3% |
|
Supported by persons in the household |
45.8% |
|
Supported by persons outside the household |
52.2% |
|
Supported by odd jobs |
64.4% |
Trade unions also have a powerful influence over the desire to work. Unions behave in a similar manner to cartels: they drive up wages for their members, limit the availability of jobs to new entrants, and punish non-observance of union rules through violence, intimidation and regulatory capture (including union-friendly laws that make union membership and/or financial contributions mandatory).
By driving up members' incomes, unions discourage work by increasing their members' demand for leisure time and sociable working hours (since the desire for leisure rises with income). Statistics SA no longer reports worker income and union membership together, so it is impossible to test some notable hypotheses, but as of 2007 union members earned R6,945 per month (compared to R4,827 per annum for non-unionized workers), representing a union wage premium of 44%.
Even adjusting for educational attainment and work experience, the wage premium for unionized workers is 32%. Unionized workers work roughly the same number of hours per week as non-unionized workers (42.8 hours vs. 42.5 hours), but unionized workers are less willing to perform additional work: only 9.3% of unionized workers (as opposed to 17.8% of non-unionized workers) are prepared to work additional hours in a given week; and, of those who will do so, unionized workers are prepared to work an additional 0.9 hours per week (as opposed to 2.4 hours per week for non-unionized workers).
Affirmative action has exceedingly poor consequences for the desire to work in South Africa. As indicated in the table, highly qualified whites are substantially less likely than blacks to find a job within 12 months of initiating a job search. For job-seekers with a tertiary qualification, blacks are 34% more likely to find work than whites.
This has, no doubt, contributed to the substantially higher percentage of whites operating their own businesses: whites are nearly three times more likely than blacks to establish their own businesses. To the extent that business owners earn more than employees over their lifetimes, affirmative action may have had the unintended consequence of raising white incomes relative to blacks.
Indeed, business owners' share of national income has increased from 39.9% in 1995 to 47.2% in 2011, while employees' share has correspondingly declined. At the same time, affirmative action, by raising the probability that black graduates find work, has artificially raised the demand for tertiary education among blacks. Yet the university system has failed to produce graduates in business-oriented fields: there are currently nearly 600,000 unemployed university graduates in South Africa, mostly in the arts, humanities and social sciences, whereas the private sector has more than 800,000 vacancies in management, engineering, law, finance, accounting and medicine.
|
Probability of finding a job within 12 months of initiating search (%) |
Percentage operating a business |
|||||
|
All races |
Black |
White |
All races |
Black |
White |
|
|
No schooling |
3.3 |
3.4 |
0.0 |
1.1 |
1.2 |
0.0 |
|
Grade 8 |
19.4 |
16.5 |
9.2 |
3.9 |
4.2 |
2.3 |
|
Grade 10 |
24.6 |
22.2 |
26.9 |
4.8 |
5.0 |
4.6 |
|
Grade 12 |
40.6 |
36.7 |
44.3 |
5.4 |
4.5 |
10.7 |
|
NTC III |
51.6 |
47.0 |
49.3 |
14.3 |
6.1 |
23.2 |
|
Diploma plus Grade 12 |
64.6 |
68.4 |
54.2 |
6.7 |
3.8 |
13.7 |
|
Bachelors degree |
63.7 |
74.4 |
53.4 |
11.1 |
4.8 |
17.5 |
|
Honours degree |
71.2 |
81.7 |
60.1 |
11.7 |
4.6 |
20.3 |
|
Masters/Doctorate |
58.7 |
66.7 |
50.3 |
20.5 |
17.3 |
23.8 |
Professional bodies, too, have an extraordinary effect on the desire to work. Professional bodies, like the erstwhile craft guilds, restrict entry into the professions, often acting in concert with universities and, typically, with legislative and regulatory quiescence. For example, the General Council of the Bar, the law societies, the Health Professions Council, the Institute of Chartered Accountants and other bodies set their own criteria (typically an exam, but often other criteria such as low-paid articleship or housemanship) as a prerequisite for entry into the professions.
A typical strategy is to use the "bell curve" to adjust pass rates each year, thus ensuring that the entry standard varies from year to year while the number of entrants is tightly controlled. By contrast fields such as physics, finance, engineering, economics and management do not have professional bodies. Professional bodies restrict entry, ostensibly, to maintain standards, but in fact they are a thinly veiled guise to maintain their respective professional monopolies.
For example, South Africa has 0.7 physicians per 1,000 population (fewer than Paraguay and Libya), yet hundreds of students achieving six or seven distinctions in Grade 12 are routinely turned away from medical schools every year. Despite the national shortage of doctors, South African medical schools in total admit just 9,000 MBChB students today, compared to 8,500 ten years ago, an increase of less than 1% per annum.
Accountants have not fared much better: Since 1950, accounting training has been conducted by universities, but the profession continues to set the qualifying exam; and the number of CAs (around 33,000) has increased by just 4% per annum over the past decade. Attorneys (now numbering around 20,500) have grown in number by just 3% per annum over the past ten years.
Since 2002, on the whole South African professionals' wages have escalated by 312.1% in foreign currency terms, an increase of 19.4% per annum. Consequently many South African professionals enjoy living standards above those of their peers, at the expense of a shortage of these skills for the country as a whole. The result is that tens of thousands of people with suitable capabilities who are willing to work in the professions are artificially excluded from doing so, and are forced to enter second-choice careers earning less than their aptitude and qualifications justify.
These individuals seek the possibility of training and/or working abroad, and in this way professional bodies are unwittingly responsible for the emigration of many high-skilled and talented young people. The Department of Home Affairs no longer compiles proper statistics on emigration, so it is difficult to know how substantial this effect is.
There are countless disincentives to work in South Africa. As the preceding statistics show, any review of labour market laws and regulations should incorporate not only employers' incentives to hire workers, but also people's incentives to work.
Additional Data
Employment by Type
|
Occupation |
Employment Dec 2011 |
Percentage change vs. Nov 2011* |
|
Unofficial sector |
6,260,316 |
1.74 |
|
Official sector |
12,859,564 |
8.87 |
|
Typical (permanent, full-time) |
8,988,313 |
6.20 |
|
Atypical (temporary, part-time) |
3,871,251 |
15.10 |
|
- of which agencies |
1,003,837 |
4.82 |
|
Total |
19,119,880 |
6.52 |
* Annualized
Employment by Sector
|
Sector |
Employment Dec 2011 (000s) |
Percentage change vs. Nov 2011* |
|
Mining |
303 |
7.97 |
|
Manufacturing |
1,338 |
5.41 |
|
Electricity, gas and water supply |
88 |
0.00 |
|
Construction |
513 |
4.70 |
|
Wholesale and retail trade |
1,680 |
7.91 |
|
Transport, storage and communication |
546 |
15.58 |
|
Financial intermediation, insurance, real estate and business services |
1,639 |
8.85 |
|
Community, social and personal services |
2,673 |
4.05 |
* Annualized
Employment by Occupation
|
Occupation |
Employment Dec 2011 (000s) |
Percentage change vs. Nov 2011* |
|
Legislators, senior officials and managers |
1,077 |
1.12 |
|
Professionals |
712 |
3.38 |
|
Technical and associate professionals |
1,604 |
1.50 |
|
Clerks |
1,482 |
9.80 |
|
Service workers and shop and market sales workers |
1,817 |
10.67 |
|
Skilled agricultural and fishery workers |
98 |
0.00 |
|
Craft and related trades workers |
1,410 |
6.85 |
|
Plant and machine operators and assemblers |
998 |
4.83 |
|
Elementary occupation |
2,365 |
8.17 |
|
Domestic workers |
845 |
12.92 |
* Annualized
Issued by Adcorp, January 10 2012
Click here to sign up to receive our free daily headline email newsletter
