
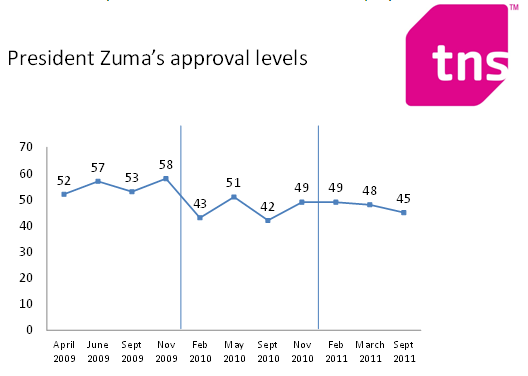
President Zuma's approval level in metro areas shows a slow decline
In 2009, President Zuma's approval levels were good, averaging in the mid-fifties. After a year of volatility during 2010, President Zuma's approval level for September 2011 shows a slow decline - 45% of metro adults approve of the way the President is doing his job. This is according to a survey released today by TNS, South Africa's leading marketing and social insights company, which has been tracking approval levels of the incumbent President for many years. The studies are each conducted amongst a sample of 2 000 SA adults from the seven major metropolitan areas of South Africa, interviewing them face-to-face in their homes, with a margin of error of under 2.5%.
The President's approval levels showed considerable volatility during 2010, dropping to 43% in February of that year from an end-2009 high of 58% - the best reading of his tenure so far. May showed a partial recovery but the September figures showed a sharp decline with some recovery in November to 49%, a figure maintained in the first reading for 2011 and staying essentially the same at 48% for March 2011. However, the September figure shows a drop to 45% with the net positive reading dropping to just 4%.
|
% |
April 2009 |
June 2009 |
Sept 2009 |
Nov 2009 |
Feb 2010 |
May 2010 |
Sept 2010 |
Nov 2010 |
Feb 2011 |
Mar 2011 |
Sept 2011 |
|
Approve |
52 |
57 |
53 |
58 |
43 |
51 |
42 |
49 |
49 |
48 |
45 |
|
Disapprove |
29 |
13 |
19 |
23 |
41 |
33 |
44 |
34 |
35 |
38 |
41 |
|
Don't know |
19 |
31 |
28 |
19 |
17 |
16 |
15 |
17 |
16 |
14 |
14 |
|
Net positives* |
+23 |
+44 |
+34 |
35 |
+2 |
+18 |
-2 |
+15 |
+14 |
+10 |
+4 |
* Net positives are given by subtracting those who feel he is NOT doing a good job from those who feel he IS doing a good job.
The March study was conducted in the first two weeks of March 2011, at the start of the local government elections campaigning. The latest reading was conducted between 25 August and 12 September. This time period coincides with the early stages of Julius Malema's disciplinary hearing, the announcement of Justice Moegeng Moegeng as Mr Zuma's nominee for Chief Justice but was prior to the announcement of an enquiry into the arms deal.
Who is more or less positive?
Unfortunately, political views in South Africa tend to have a strong correlation with race. This is best illustrated in the following table:
|
% |
Blacks 2009 |
Blacks 2010 |
Blacks 2011 |
Whites 2009 |
Whites 2010 |
Whites 2011 |
||||||||||||||||
|
Apr |
Jun |
Sept |
Nov |
Feb |
May |
Sep |
Nov |
Feb |
Mar |
Sept |
Apr |
Jun |
Sept |
Nov |
Feb |
May |
Sept |
Nov |
Feb |
Mar |
Sept |
|
|
Approve |
73 |
75 |
67 |
75 |
58 |
67 |
54 |
62 |
63 |
62 |
62 |
16 |
24 |
29 |
22 |
17 |
19 |
17 |
25 |
22 |
20 |
21 |
|
Dis-approve |
9 |
4 |
9 |
11 |
27 |
18 |
33 |
22 |
22 |
24 |
26 |
64 |
36 |
43 |
45 |
64 |
60 |
60 |
54 |
60 |
62 |
64 |
|
Don't know |
17 |
21 |
24 |
14 |
15 |
15 |
13 |
16 |
15 |
13 |
12 |
21 |
40 |
28 |
32 |
19 |
21 |
23 |
21 |
18 |
18 |
15 |
|
Net positives* |
+64 |
+71 |
+58 |
+64 |
+29 |
+49 |
+19 |
+40 |
+38 |
+38 |
+36 |
-48 |
-12 |
-14 |
-23 |
-47 |
-41 |
-43 |
-29 |
-38 |
-42 |
-43 |
|
% |
Coloureds 2009 |
Coloureds 2010 |
Coloureds 2011 |
Indians/Asians 2009 |
Indians/Asians 2010 |
Indians/Asians 2011 |
||||||||||||||||
|
Apr |
Jun |
Sept |
Nov |
Feb |
May |
Sept |
Nov |
Feb |
Mar |
Sept |
Apr |
Jun |
Sep |
Nov |
Feb |
May |
Sep |
Nov |
Feb |
Mar |
Sept |
|
|
Approve |
11 |
23 |
31 |
38 |
15 |
23 |
27 |
26 |
25 |
25 |
15 |
25 |
35 |
38 |
29 |
18 |
43 |
17 |
26 |
36 |
27 |
10 |
|
Dis-approve |
68 |
19 |
26 |
35 |
66 |
59 |
60 |
55 |
59 |
63 |
69 |
49 |
23 |
35 |
50 |
65 |
48 |
69 |
62 |
45 |
60 |
75 |
|
Don't know |
21 |
58 |
43 |
27 |
18 |
19 |
13 |
19 |
17 |
13 |
16 |
26 |
43 |
27 |
21 |
17 |
9 |
14 |
12 |
19 |
13 |
16 |
|
Net positives* |
-57 |
+4 |
+5 |
+3 |
-51 |
-36 |
-33 |
-29 |
-34 |
-38 |
-54 |
-24 |
+12 |
+3 |
-21 |
-47 |
-5 |
-52 |
-36 |
-9 |
-33 |
-65 |
* Net positives are given by subtracting those who feel he is NOT doing a good job from those who feel he IS doing a good job.
- The September 2011 reading for blacks is effectively unchanged.
- The figures for whites are also unchanged.
- For coloureds, sentiment has shifted strongly more negatively.
- For Indians/Asians, there is more volatility but the latest reading is by far the poorest recorded during Mr Zuma's tenure.
Differences by area
There are usually strong regional differences in such ratings. These are outlined below for 2010 and for 2011:
|
|
|
|
2010 |
2011 |
|||||
|
|
|
|
Feb |
May |
Sept |
Nov |
Feb |
Mar |
Sept |
|
Gauteng |
|
|
47 |
57 |
49 |
56 |
56 |
55 |
51 |
|
|
Johannesburg and environs |
|
50 |
60 |
50 |
59 |
58 |
58 |
52 |
|
|
|
Johannesburg excl Soweto |
48 |
54 |
53 |
57 |
58 |
57 |
45 |
|
|
|
East Rand |
54 |
64 |
53 |
68 |
57 |
59 |
57 |
|
|
|
West Rand |
47 |
62 |
55 |
47 |
47 |
61 |
53 |
|
|
|
Soweto |
50 |
70 |
59 |
56 |
71 |
66 |
64 |
|
|
|
Vaal Triangle/South Rand |
49 |
47 |
40 |
48 |
57 |
48 |
42 |
|
|
|
Pretoria |
35 |
45 |
37 |
45 |
49 |
45 |
46 |
|
Cape Town |
|
|
23 |
24 |
23 |
27 |
22 |
18 |
22 |
|
Durban |
|
|
49 |
60 |
41 |
52 |
55 |
55 |
48 |
|
Eastern Cape |
|
|
39 |
51 |
34 |
40 |
43 |
40 |
48 |
|
|
Port Elizabeth |
|
36 |
42 |
39 |
43 |
44 |
38 |
45 |
|
|
East London |
|
47 |
71 |
24 |
35 |
40 |
45 |
53 |
|
Bloemfontein |
|
|
48 |
65 |
40 |
60 |
59 |
73 |
48 |
Over the year, the drop in Gauteng occurs in most areas. Durban shows a notable drop, linked to the very poor Indian/Asian results, whilst the Eastern cape shows some improvement. Bloemfontein shows a drop. Overall, Gauteng, along with Durban, Bloemfontein and the Eastern Cape have the highest approval levels. Cape Town has by far the poorest figures.
Other notable differences
In terms of age group, people aged 18 to 34 years are the most positive at 52% (51% in March) whilst those aged 60 years and more are the least positive at 30% (well down from the 40% of March). In terms of language group, the most positive are those whose home language is isiZulu at 66% (69%in March) and Tswana speakers (65%). Of the black language groups, those whose home language is Sotho have the lowest approval level at 53%.
Our take out
President Zuma's approval levels in metro areas, as measured in September, show a long slow decline overall since the highs of November 2009. The declines in recent months have been more marked amongst coloureds and Indians/Asians.
Technical note
All the studies were conducted amongst 2 000 adults (1260 blacks, 385 whites, 240 coloureds and 115 Indians/Asians) in the seven major metropolitan areas: it has a margin of error of under 2.5% for the results found for the total sample. The studies use probability sampling techniques and are fully representative of the major metropolitan areas. The studies were conducted by TNS South Africans part of their ongoing research into current social and political issues and were funded by TNS.
Statement issued by Neil Higgs, Senior Advisor and Head: Innovation, TNS South Africa, October 3 2011
Click here to sign up to receive our free daily headline email newsletter
