
General household survey 2013
Introduction
This statistical release presents a selection of key findings from the General Household Survey (GHS) 2013. The survey was conducted by Statistics South Africa (Stats SA) from January to December 2013 (see full report here - PDF.)
Purpose
The GHS is an annual household survey conducted by Stats SA since 2002. The survey replaced the October Household Survey (OHS) which was introduced in 1993 and was terminated in 1999. The survey is an omnibus household based instrument aimed at determining the progress of development in the country. It measures, on a regular basis,the performance of programmes as well as the quality of service delivery in a number of key service sectors in the country.
The GHS covers six broad areas,namely education,health and social development,housing, household access to services and facilities, food security, and agriculture.
This report has three main objectives: firstly, to present the key findings of GHS 2013. Secondly, it provides trends across a thirteen year period, i.e. since the GHS was introduced in 2002; and thirdly, it provides a more in-depth analysis of selected service delivery issues. As with previous reports, this report will not include tables with specific indicators measured, as these will be included in a more comprehensive publication of development indicators, entitled Selected development indicators (P0318.2).
Survey scope
The target population of the survey consists of all private households in all nine provinces of South Africa and residents in workers' hostels. The survey does not cover other collective living quarters such as students' hostels, old-age homes, hospitals, prisons and military barracks, and is therefore only representative of non-institutionalised and non-military persons or households in South Africa.
The findings of the GHS 2013 provide a critical assessment of the levels of development in the country as well as the extent of service delivery and the quality of services in a number of key service sectors. Amongst these are: education, health, disability, social security, religious affiliation and observance, housing, energy, access to and use of water and sanitation, environment, refuse removal, telecommunications, transport, household income, access to food, and agriculture. Some topic covered such as religious affiliation and observance are totally new, whilst others, such as education, were deepened by focusing on access to work- and textbooks. Below is an executive summary of finding of each of the areas mentioned.
Summary and key findings
Education
Research confirms that addressing the early childhood development needs of those aged Q-4 years pays significant dividends. South Africa has, in this regard, made comprehensive early childhood development (ECD) programmes a very important educational priority. The ECD programmes are offered at day-care centres,creches, playgroups, nursery schools and in pre-primary schools. At the time of the survey,34% of the Q-4-year-olds attended these kinds of institutions. Disparities are observed in terms of coverage by province. For instance,49,5% of those aged 0-4 years were enrolled in these institutions,while 47,4% were enrolled in Gauteng. A much lower enrolment was, however, observed amongst children in KwaZulu-Natal (23,2%) and Northern Cape (23,8%).
As far as attendance of an educational institution is concerned,nationally,73,5% of persons aged 5-24 were attending educational institutions. This is almost the same level as observed in 2002 when the attendance rate was 73,6%. Whilst the percentage in this broad age group has not changed,at peak ages of 7-16 years, attendance is almost universal.A lack of money for fees remains the primary reason cited by a large proportion of individuals in this age group who were not studying. More than one-quarter (25,3%} of premature school leavers in this age group mentioned 'a lack of money' as the reason for not studying. The comparable figure is as high as 44,9% in KwaZulu-Natal. Whilst this observation is true, the data also suggest that the 'No fee' school system and other funding initiatives are beginning to show results. The percentage of learners who reported that they were exempted from paying tuition fees increased from 0,4% in 2002 to 62,4% in 2013. The highest proportion of no school fee paying leaners were found in Limpopo (88,8%} and Eastern Cape (73,5%}. However, in some provinces learners were less likely to benefit from the 'No fee' system, such as in Gauteng and Western Cape where only 31,7% and 27,0% of learners,respectively,benefited from this system.
In 2013,94,0% of the surveyed pupils were attending public schools. Almost three-quarters (74,5%} of learners who attended public schools benefited from feeding schemes. This percentage has steadily increased from 67,8% in 2010. Learners in Limpopo (93,2%}, Eastern Cape (88,4%} and Mpumalanga (83,2%} benefitted the most from these schemes.
Although the proportion of learners indicating that they experienced corporal punishment at school decreased from 16,7% in 2011to 13,5% in 2013, very large increases were reported in Mpumalanga (from 6,7% to 10,3% during this period}.This form of punishment continues to be commonly experienced by learners in Eastern Cape (24,1%) and KwaZulu-Natal (22,2%).
Approximately 740 893 students were enrolled at higher educational institutions during 2013. Almost two-thirds (66,4%} of these students were black African. However, proportionally this group is still under represented. Only 3,2% of Black Africans aged 18 to 29 years were studying as opposed to 9,2% of Indian/Asian individuals and 18,7% of the white population in this age group. Only 3,1% of the coloured population was studying during 2013.
Educational attainment outcomes continue to improve with improved access to educational facilities and services. Among individuals aged 20 years and older, the percentage who attained Grade 12 as their highest level of education increased from 21,9% in 2002 to 27,7% in 2013. The percentage of these individuals with tertiary qualifications furthermore improved from 9,3% to 12,8% whilst functional illiteracy declined from 27,3% to 16,2% between 2002 and 2013. While women have historically been more likely to be functionally illiterate, findings show that men in the age group 20-39 years were consistently less likely to have completed their primary school education than their female peers. The study also found that 92,9% of South Africans were able to read and write. The adult literacy rate, however, lagged behind this average in provinces such as Mpumalanga and Limpopo where 88% of populations in both provinces were literate.
Health
Nearly seven in every ten (69,9%) households reported that they went to public clinics and hospitals as their first point of access when households members fell ill or got injured. By comparison,a quarter 24,2% of households indicated that they would go to private doctors. A further 4,7% preferred private clinics or hospitals. Most households (92,1%) went to the nearest facility of its kind. Of those that preferred to travel further to access health facilities, 15,7% presented long waiting periods as a reason for securing services beyond their normal catchment areas. Nearly a quarter (24,5%) of South African households had at least one member who belonged to a medical aid scheme. A relatively small proportion 18,4% of the individuals in South Africa belonged to a medical aid scheme in 2013. The study found that 82,5% of households that attended public health-care facilities were either very satisfied or satisfied with the service they received compared to 98% of households that attended private health-care facilities. A slightly larger percentage of households that attended public facilities (5,7% as opposed to private facilities 0,7%) were very dissatisfied with the service they received.
Disability
The percentage of persons over the age of four years with disabilities increased from 5,6% in 2009 to 6,2% in 2010 before decliningto 5,4% in 2013. In 2013,North West was home to the highest percentage of disabled individuals (8,1%), while the lowest percentage was observed in Gauteng (3,9%).
Social security
Out of the total population, the percentage of individuals who benefited from social grants increased from 12,7% in 2003 to 30,2% in 2013. Simultaneously,the percentage of households that received at least one grant increased from 29,9% to 45,5%. The largest percentage of individuals who accessed social grants were in Eastern Cape (40,3%), Limpopo (38,7%) and KwaZulu-Natal (37,2%). More than half of households in Limpopo (60,6%), followed by Eastern Cape (58,5%),and Northern Cape (SS,2%) received at least one grant compared to 29,6% of households in Gauteng and 36,5% of households in Western Cape.
Religious affiliation and observance
The vast majority (85,6%) of South Africans described their religious affiliation as 'Christian' while a further 5,6% said that they were not affiliated to any religion in particular. Five percent of individuals subscribed to religions that was described as, 'ancestral, tribal, animist or other traditional African religions'. Muslims, who comprised 2% of the total, were predominantly found in Western Cape, KwaZulu-Natal and Gauteng. Hindus comprised about 1% of the population of South Africa, but 3,9% of the population of KwaZulu-Natal.
Housing
Between 2002 and 2013, the percentage of households that lived in formal dwellings and whose dwellings were fully owned increased from 52,9% to 54,9% while the percentage of partially owned dwellings declined from 15,5% to 11,5% . About 12% of households had 'other' forms of tenure arrangements in 2012.
Households who resided in informal dwellings were the highest in North West, followed by Gauteng (19,8%) and Western Cape (16%). Limpopo has the smallest percentage of households living in informal dwellings (3,7%).
At the time of the survey, 15,3% of South African households were living in 'RDP' or state-subsidised dwellings. A higher percentage of female-headed (16,4%) than male-headed households (11,1%) received a government housing subsidy. Some residents have, however, raised concerns about the quality of subsidised houses and 15,9% said that the walls were weak or very weak while 15,3% regarded the dwellings' roofs as weak or very weak. About 29% of households in Eastern Cape reported problems with the quality of their walls and roofs.
Energy
The percentage of households connected to the electricity supply from the mains has increased consistently from 77,1% in 2002 to 85% in 2013. The survey found that connectivity actually decreased in North West and Gauteng over this period.
Countrywide the use of wood and paraffin for cooking decreased consistently in most provinces between 2002 and 2013. It is, however, notable that a relatively high percentage of households (44,9%} in Limpopo,and 23,9% of households in Eastern Cape were still using wood and paraffinfor cooking.
Water access and use
Although 89,9% of South African households had access to piped water in 2013, only 77,5% of Limpopo households enjoyed such access. This situation does, however, represent a substantial improvement from that of 2002 when only 73,9% of households in this province had access to piped water.
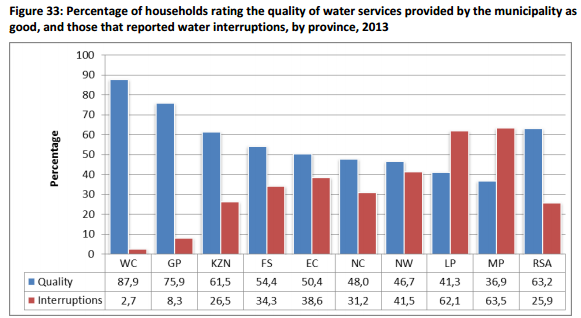
Nationally, 63,2% of households rated the quality of water-related services they received as 'good'. Satisfaction has, however,been eroding steadily since 2005 when 76,4% of users rated the services as good. Residents of Free State, Mpumalanga and Eastern Cape have consistently been least satisfied with the quality of water.
In 2013, 18,1% of households in Free State felt that their water smelled bad compared to 12% of Mpumalanga households. Only 1,7% of Western Cape households expressed such a complaint. Free State households rated their water as unsafe to drink (17,3%), not clear (20,1%) and not tasting well (19,7%).
Sanitation
The percentage of households that have access to improved sanitation facilities (e.g. flush toilets or pit toilets with ventilation pipes) increased from 62,3% in 2002 to 77,9% in 2013. Only 50% of households in Limpopo and about two-thirds (62,7%) of households in Mpumalanga had access to improved sanitation facilities. The largest improvement is observed in Eastern Cape where the percentage of households with access to improved sanitation facilities improved from 33,5% in 2002 to 71,2% in 2013.
The percentage of households who had no access to toilet facilities or who used bucket toilets decreased from 12,3% in 2002 to 5,3% in 2013. The highest proportions of households that had lack of access to toilet facilities or were still using bucket toilets were found in Eastern Cape (10%),followed by Free State (7,7%) and Northern Cape (7,4%).
More than one-quarter of households that shared toilet facilities complained about the poor hygiene (25,6%) and poor lighting (25,1%) at these facilities. A further 22% felt that their physical safety were threatened when they had to use the facilities, while 13,1% of households felt that the toilets were not adequately enclosed.
Refuse removal
The percentage of households for which refuse were removed at least once per week increased from 56,7% in 2002 to 63,5% in 2013. Concurrently, the percentage of households that had to rely on own refuse dumps or communal refuse dumps respectively declined from 31,8% to 29,2% and 3,1% to 1,6%. Large variations, however, remain between rural and urban areas. While 89,2% of households in metropolitan areas, and 84,3% of households in urban areas could rely on weekly kerbside removal, this was the case for only 6,9% of rural households. By comparison,86,5% of rural households used their own refuse removal facilities compared to 9% of urban and 4,2% of metro households.
Telecommunications
The survey (GHS) found that there was high access to telecommunications for households nationally, as only 5% of households did not have access to either landlines or cellular phones in 2013. By comparison, 81,9% of households had access to at least one cellular phone, while 12,9% of households had access to both a landline and a cellular phone. Only 0,2% of households had only a landline. However access to these means of communication differed by province as a smaller percentage of households in Northern Cape (13%) and Eastern Cape (10,6%) had access to cellular and landline services together. Households in historically rural provinces such as Mpumalanga (90,6%) and Limpopo (92,6%) were very reliant on the more accessible cellular telephones than landlines. By contrast, a combination of both cellular phones and landlines in households were most prevalent in the more affluent provinces,namely Western Cape (29%} and Gauteng (16,7%).
More than a third of South African households (40,9%) had at least one member who used the Internet either at home,workplace,place of study,or Internet cafes. More than half of households in Western Cape (54,4%) and Gauteng (54%) had access to the Internet while only just over a fifth of households in Limpopo (21,9%) had access to the Internet.
Transport
Taxis were the most commonly used form of public/subsidised transport in South Africa as 40,2% of households had at least one household member who used a minibus/sedan taxi or bakkie taxi during the week preceding the survey. More than two-thirds (69,5%) of the individuals that attended an educational institution walked to get there compared to less than almost one-fifth (18,8%) of those that went to work. Only 9,1% of individuals travelling to school travelled by private car while a further 6,8% used taxis. Private vehicles remained the most common source of transport for individuals travelling to work (33,6%), followed by taxis (22,5%). Approximately 12,3% of the working population worked from home and therefore needed no transport.
Environment
Waste removal problems and littering (36%) as well as land degradation and soil erosion (33,9%) were the two environmental problems that concerned the highest percentage of households. The percentage of households that felt that there were problems with littering and waste removal in their areas increased significantly since 2003 when this question was first included in the questionnaire. Then 28,8% of households regarded this as a problem. In 2013, a lower percentage of households considered air pollution as a problem (19%) than almost a decade earlier in 2003 when 22,8% of households considered this to be a problem.
Household income sources
Most households in South Africa continued to rely on incomes from salaries. Nationally, salaries (64,7%) and grants (45,7%) were received by the highest percentages of households. Provincially, 78,5% and 74,8% of households in respectively Western Cape and Gauteng received salaries as a source of income, while 60,8% of households in Limpopo and 58,7% of households in Eastern Cape received grants as a source of income. More than a third of households in Eastern Cape (37,4%) and Limpopo (32,3%) had social grants as their households' main source of income while more than two-thirds of households in Western Cape (72,7%) and Gauteng (72%) had salaries as the main source of income. Almost a fifth (18,3%) of households in Limpopo had remittances as a main source of income.
Access to food
Although household access to food has improved since 2002, it has remained but has remained static since 2011. The Household Food Insecurity Access Scale which is aimed at determining households' access to food showed that the percentage of South African households with inadequate or severely inadequate access to food decreased from 23,9% in 2010 to 23,1% in 2013. During this time, the percentage of individuals that were at risk decreased from 28,6% to 26%. Between 2002 and 2013, the percentage of households that experienced hunger decreased from 29,3% to 13,4% while the percentage of individuals who experienced hunger decreased from 23,8% to 11,4%. Since 2011,the percentage of individuals who experienced hunger increased very slightly by +0,3% to 13,4%.
Agriculture
Less than a fifth of South African households (18,9%) were involved in agricultural production. Most crop production took place in backyard gardens, and households involved in agricultural activities were mostly engaged in the production of food. Food production consisted of grains (51,7%), fruit and vegetables (45,2%), poultry (40,8%) and livestock farming (51,5%).
Households in Limpopo (46,6%), Eastern Cape (35,3%) and Mpumalanga (31,2%) tended to be more involved in agricultural activities, while households in more urbanised provinces such as Western Cape (2,8%) and Gauteng (4,1%) tended to be least involved in such activities. The vast majority (76,9%) of households that were involved in agriculture did it to grow additional food for household use. Nationally, only 4,7% of households became involved in commercial agriculture in order to supplement household income.
Mr Pali Lehohla Statistician-General
The full report can be accessed here - PDF.
Issued by StatsSA, June 18 2014
Click here to sign up to receive our free daily headline email newsletter
