
Democracy and popular political norms in South Africa (II) – How coherent are popular political norms?
5 March 2019
INTRODUCTION
This brief will continue to consider popular political norms as reflected in the Afrobarometer Round 6 South African Survey [1] .
The coherence of popular political perceptions will be assessed in three ways:
1. Categorisation of respondents by their answers to the following questions:
- Whether the concept of democracy is recognised and whether a meaning can be attached to it
- Whether democracy is preferable, or whether there is indifference to it or a view that sometimes non-democratic government is preferable
- Whether respondents are willing or unwilling to live under a non-democratic government which can impose law and order, and deliver houses and jobs.
2. Whether some responses to the normative questions cluster together and, if they do, the implications.
3. The relationship between the findings of (1) and (2).
ANALYSIS
1. Respondents can be placed into one of five mutually exclusive and collectively exhaustive categories, based on responses to questions about (a) the understanding of democracy, (b) the orientation towards it and (c) willingness or unwillingness to live under a non-elected government which delivers law and order, houses and jobs [2] :
- Consistent democrats. These are people who recognise the concept of democracy and can define at least one characteristic of it, who regard democracy as preferable and are unwilling to live under a non-democratic government even if it can impose law and order and deliver houses and jobs. These are 26% of the total.
- Inconsistent democrats. These are people who recognise the concept of democracy and can define at least one characteristic of it, but who take the view that sometimes non-democratic government is preferable. At the same time they are unwilling to live under a non-democratic government even if it can impose law and order and deliver houses and jobs. Also included here are those that understand the concept of democracy, take a neutral view of it, are indifferent to it, but are unwilling to live under a non-democratic government. These are 4% of the total.
- Conditional democrats. These are people who recognise the concept of democracy and define at least one characteristic of it in positive terms, who regard democracy as preferable, but are willing to live under a non-democratic government if it can impose law and order and deliver houses and jobs. For them, authoritarianism is acceptable if it delivers, but democracy is preferred. These are 45% of the total.
- Authoritarians. These are people who (a) recognise the concept of democracy and define at least one characteristic of it in neutral terms, who take the view that sometimes non-democratic government is preferable, and are willing to live under a non-democratic government if it delivers or (b) recognise the concept of democracy and define at least one characteristic of it in negative terms. These are 20% of the total.
- The uncertain. These are people who cannot either recognise the concept of democracy or assign it a meaning, or who have no opinion about whether a democracy is preferable or not or who have no opinion about whether they are willing to live under a non-democratic government if it can impose law and order and deliver houses and jobs. These are 5% of the total.
Table 1 sets out the distributions by population group and socio-economic status.
Table 1 - Categories by population group and socio-economic status
|
|
Black |
Coloured |
Asian |
White |
|
|
|
|
|
|
|
|
|
Consistent democrats |
26% |
27% |
35% |
20% |
|
|
Inconsistent democrats |
3% |
6% |
4% |
9% |
|
|
Conditional democrats |
48% |
38% |
37% |
34% |
|
|
Authoritarians |
18% |
20% |
22% |
37% |
|
|
Don't know |
5% |
10% |
2% |
1% |
|
|
|
|
|
|
|
|
|
|
Poorest 20% |
Next 20% |
Middle 20% |
Next 20% |
Richest 20% |
|
|
|
|
|
|
|
|
Consistent democrats |
20% |
29% |
21% |
31% |
27% |
|
Inconsistent democrats |
4% |
3% |
3% |
5% |
7% |
|
Conditional democrats |
51% |
47% |
47% |
39% |
44% |
|
Authoritarians |
16% |
18% |
23% |
22% |
21% |
|
Don't know |
10% |
3% |
5% |
3% |
2% |
There are significant [3] associations between category and population group and category and socio-economic status. Asians are most likely to be consistent democrats and Whites the least likely. Blacks are most likely to be conditional democrats and Whites the least likely. The poorest socio-economic quintile are more likely to be conditional democrats than the other four quintiles. Authoritarianism is more prevalent in the three top quintiles than in the bottom two and, not surprisingly, the highest proportion of the ‘don’t knows’ are in the bottom quintile.
These findings are not reassuring. While 64% of the respondents regard democracy as preferable, and a further 9% would not be willing to live under a non-elected government which delivers, over 60% of all respondents would be willing to live under such a non-elected government. Now, while China delivers high quality authoritarianism, it is unknown in sub-Saharan Africa [4] . A non-elected government which provides law and order, and jobs and housing is a chimera on this continent. But it might be an attractive fantasy for a democracy in trouble. And once installed, a non-elected government might arouse the opposition of only a minority of the population.
2. Factor analysis [5] shows that most of the normative responses [6] cluster into two sets:
- A political system set (the acceptance or rejection of one-party or military or dictatorial rule or a return to apartheid)
- A checks and balances set (regular elections, presidential accountability to parliament, an independent press, legislative power reserved to parliament, presidential obligation to obey the law, and a two-term limit on presidential tenure).
The two factor scores show little correlation, so it is not the case that all respondents who reject authoritarian systems are committed to checks and balances, and vice versa.
The political system factor scores can be used to divide respondents into three equally sized groups, depending on their attitudes towards the political system. The checks and balances factor scores can be used to divide respondents into three equally sized groups, depending on their attitudes towards checks and balances. The two three-way classifications can be used to construct the 3 x 3 Table 2, which shows the percentage of the respondents in each cell of the table. ‘High’ for both the political system factor and the checks and balances factor indicates the most democratic responses.
Table 2 – The distribution of respondents across political system
|
|
Political system factor |
||
|
Checks & balances factor |
Low |
Medium |
High |
|
Low |
14% |
10% |
8% |
|
Medium |
9% |
12% |
12% |
|
High |
10% |
11% |
13% |
The consistent respondents are those on the diagonal running from top left to bottom right and constitute 39% of total respondents. The most inconsistent responses are in the top right and bottom left cells and account for 18% of total respondents. An intermediate level of inconsistency exists in the remaining four cells, accounting for 42% of respondents.
3. Finally, there is virtually no correlation between the categories defined in paragraph 1 and the factors defined in paragraph 2. Table 3 sets out mean factor scores by category.
Table 3 – Mean factor scores
|
Category |
Political system |
Checks and balances |
|
Consistent democrat |
1.93 |
2.09 |
|
Inconsistent democrat |
2.19 |
2.15 |
|
Conditional democrat |
2.05 |
1.96 |
|
Authoritarian |
2.18 |
1.92 |
|
Don’t know |
3.57 |
1.87 |
Lower factor scores imply high constitutional conformity. All that can be said about Table 3 is that the ‘Don’t knows’ prefer more authoritarian political systems.
CONCLUSION
The analysis indicates a low level of coherence in normative political attitudes. Coherence would require:
1. A high level of correlation between all the political system responses and checks and balances responses. Instead, the political system responses and checks and balances cluster into separate groups with almost no correlation between them [7] .
2. A high level of correlation between responder categories and the average political system and checks and balances scores in Table 3. Instead, less than 3% of the variance in the political system score is explained by the categories and less than 1% of the checks and balances score is so explained.
The first brief found a fairly high degree of constitutionally conforming responses among the Afrobarometer respondents. This brief demonstrates that these responses can be regarded as intuitively based, rather than resulting from a coherent view of how and why the components of our constitutional democracy are related. This conclusion qualifies the relatively optimistic conclusions of the first brief, and it suggests that much needs to be done to develop a coherent civic culture compatible with our constitution.
Charles Simkins, Head of Research, Helen Suzman Foundation.
This article first appeared as an HSF Brief.
APPENDIX
The calculation of the political system and checks and balances factors
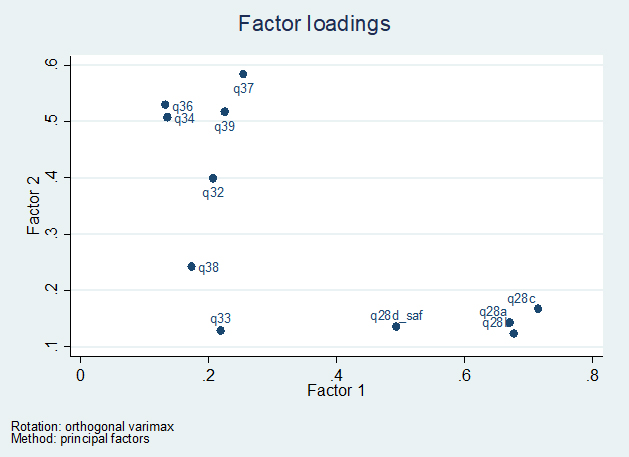
Appendix 2 of the first brief explains how factors clustering variables can be obtained from ordinal categorical responses, by first calculating a polychoric correlation matrix and then applying a factor analysis. Factors are a predominantly a function of the variables they cluster and correlation coefficients between factor and the variables associated with them are called factor loadings.
The variables on which the factor analysis is based are:
|
q28a |
Reject one-party rule |
|
q28b |
Reject military rule |
|
q28c |
Reject one-man rule |
|
q28d |
Reject return to apartheid |
|
q32 |
Regular elections |
|
q34 |
President monitored by parliament |
|
q36 |
Investigative media |
|
q37 |
Parliament makes laws |
|
q38 |
President must obey laws |
|
q39 |
Two term limit |
Figure 1 displays the factor loadings and demonstrates the clustering of variables.
[1] For a list of the Survey questions under consideration, see Appendix 1 of the first brief
[2] The questions considered here are 29a, 29e, 30 and 30b.
[3] At the 5% level
[4] Only two countries rated as partly free or not free had incomes per capita higher then $10 000 in purchasing power parity dollars in 2016: Equatorial Guinea (population 1.2 million) and Gabon (population 1.9 million). Both are oil producing countries, which are not known for an even spread of a high quality of life.
[5] Details are provided in the Appendix.
[6] The relevant questions are 28a, 28b, 28c and 28d (the political system questions) and 32,33,34, 36, 37, 38 and 30 (the checks and balances questions).
[7] The correlation coefficient is 0.07
