
Statistics show that expectations of e-tolls not materialising
Expectations and projections about the income that would be generated by e-tolls, is not materialising and according to statistics the FF Plus obtained following a parliamentary question the opposite seems to be happening, Adv. Anton Alberts, the FF Plus’ parliamentary spokesperson on Transport says.
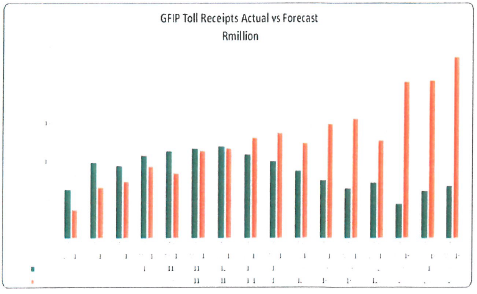
According to Adv. Alberts, a table about the real income and projections of income in the first seven months after e-tolls had been implemented in December 2013 shows that income had grown month on month following which it started a sharp decline in June 2014.
In contrast with the real income, the projections show excessive expectations which from March this year have been two-thirds higher than the real income. No figures were added to the table and the FF Plus has asked that it be provided.
From further questions it appears that the system’s total operating costs are more than R66 million a month and that the monthly registration of e-toll users is also busy sharply declining. In April this year, only 20 104 tags were registered as opposed to 71 751 in April last year and 356 766 in December 2013.
To a question as to how many tags are being de-registered every month, a non-committal reply was given without providing any figures. The FF Plus also asked for the real figures to be provided.
Adv. Alberts says the figures which were provided create a clear picture of a system which is busy collapsing and has hardly any legitimacy any more.
“It is clear that the expectations which had been created with the e-tolls were excessively high. But as to how big the system’s financial crisis really is, will only be seen when the questions are answered in full,” Adv. Alberts says.
Text of the reply:
National Assembly Question Number: 1703
Adv A de W Alberts (FF Plus) to ask the Minister of Transport:
(1) What is the revenue that was generated in each month by the e-tolling system since the day it was switched on until the latest specified date for which information is available;
(2) what is the monthly revenue required to run the e-tolling system at a profit;
(3) what are the respective monthly expenses that have to be paid by the monthly revenue from the day the e-tolling system was switched on untilthe latest specified date for which information is available;
(4) how many e-tags were registered in each month since the day the system was switched on until the latest specified date for which information is available;
(5) how many e-tags were deregistered in each month since the day the system was switched on until the latest specified date for which information is available? NW 1924E
REPLY:
The following graphs indicate the actual cash received (1) as well as the expected I forecasted revenue (2) per month.
(1) As the honourable member is aware toll roads funded by SANRAL through borrowings on the capital markets are not profit driven, but cost recovery driven. Therefore, the toll is calculated at the level where all associated costs can be covered over the approximate project of 30 years. For toll projects, the costs that must be recovered are the capital repayment of the initial construction works and all other capital works during the project period, the servicing of debt, routine maintenance costs, periodic maintenance costs (every 8 to 12 years), provision of lighting and maintenance, toll operations and toll system maintenance and Intelligent Transport Systems and Incident Management Systems towing vehicles, medical assistance, incident management vehicles.
(2)The table below shows the average monthly expenditure, excluding finance charges.
|
Monthly Expenditure for GFIP |
|
|
Intelligent Transport Systems and Incident management (ITS & I MS) |
R 6 296 786 |
|
Routine Road Maintenance |
R 7 669 109 |
|
Lighting |
R 5 020 568 |
|
Toll operations and maintenance |
R 47 025 267 |
|
Total |
R 66 011 730 |
(3) how many e-tags were registered in each month since the day the system was switched on until the latest specified date for which information is available;
|
Year |
Month |
Tags Registered |
|
2013 |
12 |
356 766 |
|
2014 |
1 |
168 494 |
|
2014 |
2 |
114 307 |
|
2014 |
3 |
89 876 |
|
2014 |
4 |
71 751 |
|
2014 |
5 |
64 103 |
|
2014 |
6 |
67449 |
|
2014 |
7 |
52 987 |
|
2014 |
8 |
41950 |
|
2014 |
9 |
35 836 |
|
2014 |
10 |
32 580 |
|
2014 |
11 |
26 470 |
|
2014 |
12 |
19 548 |
|
2015 |
1 |
25 803 |
|
2015 |
2 |
23 445 |
|
2015 |
3 |
22 867 |
|
2015 |
4 |
20 104 |
As the honourable member will note from the figures, notwithstanding the unfortunate pronouncements and continuous encouragement by the detractors of the project. law abiding citizens have continued to register and pay - they do the right thing. For that we thank them.
(4) The deregistration of vehicles is a moving target due to the nature of the management of the fleets by various fleet owners. As the honourable member is aware a tag belongs to a specific vehicle. And as fleet owners change their fleets, old vehicles are de-registered and new ones registered. Since fleet owners do not change their fleets in unison these numbers change at irregular intervals.
Statement issued by Adv. Anton Alberts, FF Plus parliamentary spokesperson: Transport, May 19 2015
