
The London School of Hygiene and Tropical Medicine and its projections of the African Covid-19 epidemic
18 May 2020
INTRODUCTION
Founded in 1899 with a donation from an Indian philanthropist, the London School of Hygiene and Tropical Medicine is the United Kingdom’s leading institution in the fields of public health and infectious diseases. It has turned its attention to modelling the COVID 19 epidemic in Africa, and South Africa in particular. This brief will outline the structure and assumptions of the projection model and the following brief will set out its projections for South Africa of 5 May 2020.
THE STRUCTURE OF THE MODEL
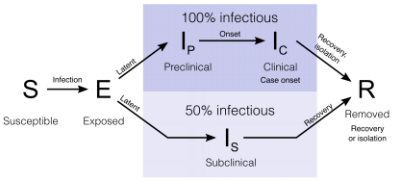
The model is an SEIR model. The population is divided into four categories. Susceptible (S) people move to the exposed (E) category when they are infected. People move from the E to the I (infectious) category when they become infectious to others. The infectious are then moved to the R (removed) category when they are isolated, or they recover or die. The infected may be asymptomatic, in which case they move through the lower path, or they may become symptomatic, moving along the upper path. The asymptomatic are assumed to be half as infectious as the symptomatic throughout.
The model is stochastic. This means that its projections have a probability distribution rather than a precise outcome. This is so because the transition probabilities between states are not known precisely, but themselves have a probability distribution. The model works by drawing a sample set of transition probabilities, advancing six hours at a time for a year. This produces a set of outcomes. The process is repeated 500 times and the set of outcomes shapes their distribution. The model is stratified by age in five year age groups up to the age of 75, with the top group being 75+.
Outcomes are then sorted by magnitude and the outcomes at the 2.5th, 25th, 75th and 97.5th percentile of the distribution are reported. The distance between the 25th and 75th percentiles is the interquartile range and the distance between 2.5th percentile and the 97.5th percentile is the 95% confidence interval.
Africa has the advantage of a young population relative to other continents. However, in low-income countries, an average person’s vulnerability may correspond to that of an individual with greater age in a high-income setting due to malnutrition, infections and often unmanaged non-communicable diseases. In the model, age-specific severity risks (probability of becoming a severe case and critical case) derived from high-income countries are shifted towards younger ages by ten years.
CALIBRATION OF THE MODEL
The model is calibrated by the use of a variety of studies round the world[1]. Some of the salient model parameters are:
|
Average period between infection and becoming infectious |
4 days |
|
Average period of pre-clinical infectiousness |
1.5 days |
|
Average period of clinical infectiousness |
3.5 days |
|
Average period of sub-clinical infectiousness |
5 days |
|
R0 |
2.6 |
|
Average delay from symptom onset to becoming a severe case |
7 days |
|
Risk of becoming a severe case |
From 0.76% for children under 10 to 61.76% for people age 70 and over |
|
Average duration of severe, non-critical disease |
8 days |
|
Proportion of severe cases which become critical |
30% |
|
Average duration of severe, critical cases |
10 days |
|
Case fatality ratio in critical cases |
75% |
|
Average period between symptom onset and death |
22 days |
INTERVENTIONS
The purpose of the model is not only to project the spread of the epidemic in the absence of mitigation. It is also to assess the impact of mitigation strategies. Three strategies are considered:
Self-isolation of symptomatic individuals.
Population-wide physical distancing, whereby all individuals reduce their contacts outside the household to a certain degree. The scenarios considered are 20% distancing and 50% distancing. Lockdown is assumed to be 80% distancing. The distancing percentage refers to the drop in contacts where infection is a possibility.
Shielding of high risk individuals by, for example placing them in physical isolation within their homes, or rehousing them. A shielding regime is specified by a coverage fraction and a reduction fraction, so 80/80 shielding is 80% coverage of 80% contact reduction. 40/80 and 80/80 scenarios are considered.
Finally two combinations are considered 80/80 shielding plus 20% distancing and 80/80 shielding plus 50% distancing.
THE PROBLEM OF DATES
Day zero for the model is when there were 50 infections. To convert model days into dates, one needs an estimate of the date of day zero. This the model does not provide because actual infections cannot be directly determined from reported cases. Certainly day zero must have been before 17 March, when 85 cases were reported. Since the first reported case was on 5 March, a reasonable estimate of day zero would be 10 March. The annexure provides a day to date conversion table on this assumption.
THE PROJECTIONS[2]
The table indicates the peak timing and values for the main outcomes. The top figure in each cell represents the timing of the peak in days from the beginning of the model and the bottom figure indicates daily new symptomatic cases and deaths and the demand for hospital beds at the peak.
To keep the table as readable as possible, only the midpoint of the interquartile range is reported. This has the disadvantage of suppressing the degree of uncertainty in these estimates, which is large. The interquartile range for the days is never less than 30 and it rises to 100 or above for later dates.
The 95% confidence intervals are wider still. This means, for instance, there is only a 50% chance that the peak date for incidence of symptomatic cases in the 20% distancing scenario lies between 120 and 180 days and for a 95% chance, the interval will widen from 100 days to 370 days. Uncertainty is also great in projections of demand for hospital beds. For instance, the critical care demand in the 80/80 shielding scenario has a 50% confidence interval from 57,000 to 110,000 and a 95% confidence interval from 11,000 to 140,000. The uncertainty should decline over time and more precise input assumptions become possible.
Table 1: Peak conditions
|
Outcome |
Unmitigated |
20% distancing |
50% distancing |
40/80 shielding |
80/80 shielding |
80/80 shielding 20% distancing |
80/80 shielding 50% distancing |
|
Incidence of symptomatic cases |
115 705,000 |
150 390,000 |
220 125,000 |
130 570,000 |
135 505,000 |
150 345,000 |
215 99,500 |
|
All hospital demand |
130 450,000 |
160 250,000 |
220 78,000 |
145 285,000 |
145 230,000 |
160 165,000 |
240 45,500 |
|
General hospital demand |
130 305,000 |
165 165,000 |
220 53,000 |
145 185,000 |
150 155,000 |
160 105,000 |
240 30,650 |
|
Critical care demand |
130 160,000 |
165 88,000 |
230 28,500 |
145 97,000 |
150 83,500 |
160 55,500 |
245 16,500 |
|
Incidence of deaths |
135 9,700 |
175 5,200 |
235 1,730 |
155 6,000 |
155 5,000 |
175 3,400 |
250 1,060 |
Twelve month cumulative outcomes are also reported and they are displayed in Table 2. The first column refers to unmitigated outcomes. The remaining columns refer to the reduction in outcomes relative to the unmitigated case associated with each intervention.
Table 2: Twelve month cumulative outcomes
|
Outcome |
Unmitigated |
20% distancing |
50% distancing |
40/80 shielding |
80/80 shielding |
80/80 shielding 20% distancing |
80/80 shielding 50% distancing |
|
|
TOTAL |
REDUCTION |
|||||
|
Symptomatic cases |
20,500,000 |
4,000,000 |
11,100,000 |
2,500,000 |
3,000,000 |
5,200,000 |
12,100,000 |
|
Hospital person-days |
15,000,000 |
3,350,000 |
7,950,000 |
3,900,000 |
5,450,000 |
7,200,000 |
10,700,000 |
|
General hospital person-days |
9,750,000 |
2,150,000 |
5,150,000 |
2,550,000 |
3,900,000 |
4,700,000 |
6,750,000 |
|
Critical hospital person-days |
5,100,000 |
1,175,000 |
2,750,000 |
1,350,000 |
2,050,000 |
2,500,000 |
3,600,000 |
|
Deaths |
310,000 |
70,500 |
170,000 |
83,000 |
125,000 |
150,000 |
215,000 |
CONCLUSION
Despite the uncertainties, the following conclusions can be drawn from the table:
Interventions can push out the expected timing of the peak can be pushed out by up to a 100 days. An unmitigated peak incidence could have been expected at the beginning of July. This date can be pushed out to as late as early October.
50% distancing radically reduces expected daily infections at the peak. If it is accompanied by 80/80 shielding, the incidence drops further. Of course, the cost of flattening the curve is that the epidemic is spread out over a longer period of time, extending the time for which shielding and distancing will be needed. The least risky strategy for those in need of shielding is to remain shielded until a vaccine is found, assuming one is.
The heaviest demand for hospital beds will come from the 60+ age group. For them, rigorous shielding for a long time will be essential. Even so, providing hospital care for the reckless and unlucky is likely to stretch capabilities to the limit and beyond.
It is clear how close to the beginning of the epidemic we still are. The model’s median projection indicates that it will get much, much worse. But it should be borne in mind that projected outcomes are highly uncertain and subject to revision in the light of new data.
Charles Simkins, Head of Research, Helen Suzman Foundation.
ANNEXURE: DAY TO DATE CONVERSION TABLE
|
Day |
Date |
|
0 |
10-Mar |
|
80 |
29-May |
|
90 |
8-Jun |
|
100 |
18-Jun |
|
110 |
28-Jun |
|
120 |
8-Jul |
|
130 |
18-Jul |
|
140 |
28-Jul |
|
150 |
7-Aug |
|
160 |
17-Aug |
|
170 |
27-Aug |
|
180 |
6-Sep |
|
190 |
16-Sep |
|
200 |
26-Sep |
|
210 |
6-Oct |
|
220 |
16-Oct |
|
230 |
26-Oct |
|
240 |
5-Nov |
|
250 |
15-Nov |
[1] A full list of the estimates of parameters is contained in tables S1 and S2 in Kevin van Zandvoort et al, Response strategies for COVID-19 epidemics in African settings: a mathematical modelling study, 3 May 2020, available at https://cmmid.github.io/topics/covid19/covid-response-strategies-africa.html
[2] See LSHTM CMMID COVID-19 Working Group, Modelling projections for COVID-19 epidemic in South Africa, 5 May 2020, available at https://ln2.sync.com/dl/b3fc9ebc0?sync_id=1394099302#36ipcgk3-5mghvhh4-vi29b9yy-8e688twu
