
JOHANNESBURG - The pursuit of race and gender representivity on the bench has been an obsession of the African National Congress since October 1998. For a brief period, during Enver Surty's term justice minister, the expertise and experience of individual applicants for judicial office was given greater weight.
However, under the direction of the new Minister of Justice, Jeff Radebe, and his allies on the JSC, the primary consideration in the choosing judges is (once again) the attainment of a judiciary which reflects the race and gender proportions of the total population.
This policy is, on the face of it, meant to widen the pool from which judges have previously been appointed. This is proving to be an optical illusion. This policy has, in reality, severely restricted the pool from which judges are appointed; and it has been used to cover-up for severe racial discrimination.
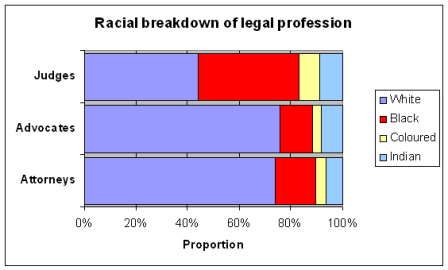
This is because judges are not appointed from the general population, but from the ranks of those with (at the very least) a legal qualification. When measured against the appropriate yardstick - the proportion they take up of the legal profession - white South Africans are now severely underrepresented on the bench. As of July 2009 44,1% of judges were white. This is considerably less than their percentage of the advocates profession (75,6%) and the attorney's profession (73,7%). See graph and tables below.
|
Table 1: Race and gender breakdown of the judicary |
||||||||||
|
|
WHITE |
BLACK |
COLOURED |
INDIAN |
Total |
|||||
|
M |
F |
M |
F |
M |
F |
M |
F |
|||
|
Chief Justice |
0 |
0 |
1 |
0 |
0 |
0 |
0 |
0 |
1 |
|
|
Deputy Chief Justice |
0 |
0 |
1 |
0 |
0 |
0 |
0 |
0 |
1 |
|
|
President/ Judge President |
2 |
- |
9 |
- |
- |
- |
- |
- |
11 |
|
|
Deputy Judge President |
2 |
1 |
2 |
- |
- |
- |
- |
- |
5 |
|
|
Judges |
71 |
13 |
50 |
16 |
12 |
4 |
10 |
8 |
184 |
|
|
Total all Judges |
75 |
14 |
63 |
16 |
12 |
4 |
10 |
8 |
202 |
|
|
% of total |
37.1% |
6.9% |
31.2% |
7.9% |
5.9% |
2.0% |
5.0% |
4.0% |
100.0% |
|
|
*Figures as of July 2009. Source: Department of Justice |
||||||||||
|
Table 2: Race and gender composition of the general council of the bar |
|||||||||
|
|
WHITE |
BLACK |
COLOURED |
INDIAN |
TOTAL |
||||
|
|
M |
F |
M |
F |
M |
F |
M |
F |
|
|
Silks |
333 |
17 |
20 |
1 |
7 |
1 |
24 |
2 |
405 |
|
Experience of 5 years & more |
752 |
149 |
113 |
27 |
24 |
12 |
55 |
34 |
1166 |
|
Under 5 years |
179 |
89 |
54 |
18 |
5 |
15 |
25 |
16 |
401 |
|
Non-contributing |
45 |
26 |
22 |
15 |
5 |
4 |
5 |
9 |
131 |
|
Total |
1309 |
281 |
209 |
61 |
41 |
32 |
109 |
61 |
2103 |
|
% of total |
62.2% |
13.4% |
9.9% |
2.9% |
1.9% |
1.5% |
5.2% |
2.9% |
100% |
|
* General bar council statistics as of April 30 2009 |
|||||||||
|
Table 3: Racial composition of the attorney's profession |
|||||
|
|
WHITE |
BLACK |
COLOURED |
INDIAN |
TOTAL |
|
Equity Partners |
8664 |
1525 |
461 |
568 |
11218 |
|
Salaried Partners |
1605 |
262 |
56 |
105 |
2028 |
|
Senior Associates |
1078 |
126 |
42 |
122 |
1368 |
|
Associates |
1322 |
466 |
146 |
287 |
2221 |
|
Consultants |
398 |
477 |
7 |
15 |
897 |
|
Total |
13067 |
2856 |
712 |
1097 |
17732 |
|
% of Total |
73.7% |
16.1% |
4.0% |
6.2% |
100% |
|
* Source: National Survey of the Attorney's Profession, Law Society of South Africa, September 2008 |
|||||
Click here to sign up to receive our free daily headline email newsletter
