
The Cape Town Story
(2006-2010)
From Patronage System to Open Opportunity Society for All
How the City of Cape Town's record over the last five years provides a template for a truly free South Africa
March 28 2011
Foreword
This booklet documents an important chapter in our country's history. One day, future generations will recognise that what started in Cape Town in the local election of 1 March 2006 was a watershed for our country.
Why do I say this?
For the first time since 1994, citizens removed an incumbent political party through the ballot box. The voters understood their power and they used it. This is the bedrock of any sustainable democracy.
The DA-led coalition that came to power during March 2006 wasn't perfect. No government ever is. But we did succeed in arresting the City's decline and turning it around, moving step by step in the direction of development and progress. No individual can take credit for this. It was a team effort. It was the result of hard work and commitment on the part of every member of the Mayoral Committee and a great many councillors. And it was due, in no small measure, to the dedication of the many City officials who view public service as a calling, not just a career. Above all, it was the choice of the majority of citizens of Cape Town.
But dedication and hard work alone were not enough. The foundation of our achievements was the fact that we applied a political philosophy that works wherever it is implemented. We call it the Open, Opportunity Society for All. In such a society, the role of the state is to give citizens the space to be who they want to be and the wherewithal to be what they want to be. The state does not try and control peoples' lives, but it does do for people what they cannot be expected to do for themselves. And it recognises that an efficient public sector depends, above all, on appointing people who are fit for the intended purpose of their jobs.
The antithesis of this is the closed, crony society for the politically-connected few. In this system, the state is captured by figures in the governing party to dispense patronage to their political contacts through tenders and ‘jobs for pals'. Institutions that promote transparency and accountability are shut down or taken over, because they threaten the survival of this patronage network.
The political contest in South Africa is between these two competing political philosophies. And it is no exaggeration to say that the outcome will determine whether or not we succeed as a nation. That is why The Cape Town Story represents a watershed in our history. It documents how the DA turned around a city in decline as a result of the closed, crony system. More than that, it shows how policies that promote openness and opportunity can, over time, have a profound impact on peoples' lives.
Our work in Cape Town is far from done. We have a long way to go before we can say "mission accomplished". Far too many people still live in poverty, there is still a huge divide between the rich and the poor. There are still people living without access to basic services. There is still much we can do to improve their lives.
But, as The Cape Town Story shows, we are moving in the right direction. If we can keep doing so, more and more people will understand that our guiding philosophy -- and the policies that emerge from it -- are the key to a successful South Africa.
Helen Zille
The Cape Town Story
Executive Summary
The administration that took power in the City of Cape Town in April 2006 inherited a city that was failing. Services were poor and getting worse, infrastructure was deteriorating and maintenance spending was palpably inadequate. The unicity, an amalgamation of all the apartheid-era municipal structures in Greater Cape Town, remained administratively divided, had shed critical capacity and was slipping into dysfunctionality. The story of the subsequent turn-around is recounted in this document. What is particularly notable is that not only was the administrative machine first salvaged and then improved, but that delivery to the poor in Cape Town was accelerated in the process.
In 2005/06 Cape Town spent only 60% of its budget, the worst performance of any metro in South Africa. Revenue collection had collapsed with over R4bn outstanding and essential services such as fire, policing and health were understaffed and inadequately equipped. Although the council itself was renowned for corruption, the political deployees who made up its senior management were the best paid in the country. The morale of staff was in tatters, with obvious knock on effects for efficiency and standards of service.
The new administration had a very clear philosophical orientation; the Open Opportunity Society for All. This is a society in which all South Africans are free and equal in rights, and in which each has the opportunity to go as far as their talents will take them, and in which every South African has the space to be whatever they wish to be. But it knew that such a dream had to be underpinned by effective administration. So the first act of the new administration was to cut external debt, and to provide an emergency allocation (R58.6m) to run-down services, especially nursing, fire-fighting and policing.
The new administration's strategy was to promote infrastructure-led economic development with the intention of creating jobs and attracting investment to Cape Town. As a first step it had to complete the amalgamation of the seven separate administrations that were brought together to form the Cape Town Metro in 1999/00. It had to undo the effects of the previous regime's spoils system, equalise conditions of service, deal with duplication and sort out a legacy of deploying people without the requisite skills to lucrative jobs as a political reward. That process took three years. By 2009, the Cape Town was, in the words of its City manager, "ready to roll up its sleeves and get its hands dirty in order to deliver of the needs and expectations of all (its) citizens".
Greater efficiency allowed the city to spend its budget and to do so effectively. It increased spending on infrastructure from R5bn in 2001-2006 to R19bn in 2006-2010, partly helped by national government transfers to prepare for FIFA 2010. But while the soccer World Cup spending may distort direct comparisons of capital expenditure, other spending figures tell a straightforward story of recovery. Spending on repairs and maintenance, something sorely neglected by the previous regime, tripled to R1,6bn/year. While only 7km of old water pipe had been replaced in the 4 years before 2006, the new City administration achieved 40kms/year. Revenue collection rose to 96%. This was a firm but far from brutal process. In fact 16% of the poorest households in Cape Town experienced an actual reduction to their municipal account in 2006/07.
To prevent corruption and enhance accountability, the new administration opened up government. The City's Bid Adjudication Tender Award Committee, which decides all outside contracts, was opened to the public. A Standing Committee on Public Accounts, modeled on its parliamentary namesake and chaired by a councilor from an opposition party, was established. In particular, the new council gave effect to the concept of an Open Opportunity Society for All by revising the tender criteria that the previous regime had used to reward political insiders. The outcome was to nearly double the number of small black firms doing business with the city.
A better run city has had profoundly improved the lives of the poor.. The new council succeeded in nearly doubling the budget allocation for free water, subsidised housing and electricity to R776m in 2009/10. More importantly, it has put in place an Indigent Policy for those genuinely unable to afford service fees. It pushed the qualifying property value threshold up to R199 000, an enormous jump from the R88 000 under the previous regime. Properties in this category qualify for a 100% rates rebate, 6 000 litres of free water a month and50kWh free electricity.
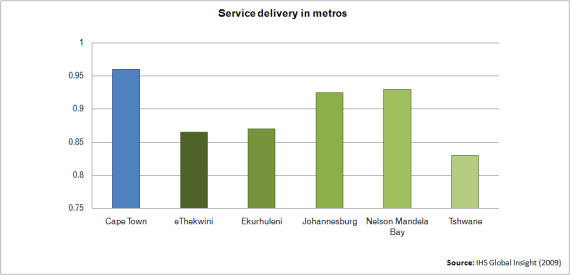
Cape Town now delivers more to its poor than any other city in the country. Four important reports confirm this claim: first, in 2009, data providers IHS Global Insight, ranked Cape Town top metro in terms of household access to water, sanitation, refuse removal and electricity; secondly, in 2010, the Support Programme for Accelerated Infrastructure Development (SPAID), a programme funded by and reporting to the Department of Cooperative Governance and Traditional Affairs, ranked Cape Town the very best in terms of citizens access to services, in a study that covered all provincial, metropolitan and district governments in South Africa; thirdly, another report compiled by the Cooperative Governance Department, the Universal Household Access to Basic Services Index, ranked Cape Town as the best metro in the country for delivering basic services; finally, Empowerdex, the BEE Ratings Agency, found that "Cape Town is clearly the best city in the country for service delivery". In 2006, Cape Town's backlog in water provision was 30 000 households. By 2010, water provision to RDP standards was 100%.
The vast poverty-stricken suburbs of Khayelitsha and Mitchell's Plain have been particular targets of development. The City's spatial development framework is premised on the need to integrate these areas better into the urban fabric of the city. In Khayelitsha, a Violence Prevention through Urban Upgrade initiative, in partnership with the German government, and with community participation at every step, has seen a massive injection of social infrastructure, including sports complexes, schools, clinics, libraries, walkways, public squares and modern public buildings. R451m was spent on Khayelitsha's new central business district; this has pulled in private investment, including two shopping malls in the area.
In housing, the chaotic 334 000 strong municipal waiting list has been overhauled, with special attention given to those who have waited longest (in one case since 1968), applicants with special needs, and eliminating the effects of corruption. Although housing delivery has accelerated from under 2 000 units in 2003 to about 9000 units in 2010, City government acknowledges that this is too little and has started to pursue in-situ upgrades. This policy allows the delivery of four times the number of housing opportunities for the same outlay in public money. The Council has also facilitated the development of sites for "Gap housing" - those who earn too much to qualify for state assistance but not enough to get bank finance (typically between R3 000 and R7 500/month).
The City of Cape Town has delivered a better life for all. Its relationship with the Cape Town Partnership means that the city has the cleanest and safest CBD of any city in South Africa. Its metro police focus on real crimes, not "greed fines"; drug busts are up from 180 in 2005 to nearly 1 000 in 2010 and the focus has shifted to arresting the "big fish" rather than petty criminals. In health, the city's Infant Mortality Rate improved from 25.2 in 2003 to 20.8 in 2009, in a context where the national rate has declined (to about 50). The Tuberculosis Smear and cure rate has shown a steady improvement from 70% in 2005 to 78% in 2008. The most recent figures (January 2011) show an 80% cure rate, the best of any metropolitan area in South Africa. The city's traffic lights work, its potholes get repaired and its Air Quality Management By-Law, the only such regulation in the country, is policed and is starting to produce results.
It seems that citizens recognise the quality of Cape Town's administration. The City's Annual Community Satisfaction Surveys show a steady increase in positive sentiment. Those who gave a positive rating to the City's role as a public service provider increased from 46% in 2007 to 57% in 2010. The use of IT (the City is a worldwide reference site for SAP), responsive call centres which are actively managed with call logging and checking processes in place, as well as CCTV (the City of Cape Town has the largest CCTV footprint in Africa) have all played a role. But behind these successes lies a mature style of government. The overwhelming consideration is that government is able to do tomorrow what has been done today, at least as well and preferably better. The achievement of that "better" end is the Cape Town Story in a nutshell.
The Cape Town Story
Introduction
Historic Cape Town, South Africa's "Mother City", is famous around the world for its scenic beauty, unique ecosystem, creative culture and vibrant blend of civilizations. It is the home of South Africa's national legislature, is the country's second largest city and was the site of Nelson Mandela's first public speech when the global icon was released after 30 years imprisonment. In July 2010, the City hosted 200 000 FIFA World Cups fans and provided the venue for a nail-biting semi-final between Uruguay and the Netherlands. But despite the city's balmy image, its sustainability cannot be taken for granted. What few visitors - businesspeople, tourists or poor urban migrants - know is that as recently as five years ago, the city was staring into an abyss.
City government had signally failed to rise to the challenge of post-apartheid administration. By the end of 2005, services were poor and getting worse, infrastructure was deteriorating and maintenance was palpably inadequate. The unicity, an amalgamation of all the apartheid-era municipal structures in Greater Cape Town, remained administratively divided, had shed critical capacity and was slipping into dysfunctionality. Far from delivering a much-anticipated post-apartheid dividend, municipal government in Cape Town was on track to becoming incapable of delivering adequate services to any of its citizens, let alone extending delivery to the poor and previously marginalised.
The election of a new city government under the leadership of the Democratic Alliance in April 2006 came just in time to avert the crisis. The new administration had no alternative but to throw itself into halting and reversing the decline. It took three years of sometimes painful choices, in a context of limited resources, to complete the turn-around. This was no coincidence; nor was it a matter of luck. In fact, during the period of recovery, the economic context deteriorated rather suddenly, as the 2008 global economic crisis bit hard. Despite the strain of turnaround, the city was able to accelerate delivery to the urban poor and has ridden out the global crisis better than any other South African city, a testament to the resilience of the system constructed since 2006.[1]
The State of the City in 2006
In September 2005, property management companies in the central city complained that raw sewage was being pushed out of manholes in the basements of their buildings.[2] A few months later, the Department of Water Affairs found that Cape Town failed to meet national standards for sewage effluent 25% of the time[3]. A study by the Institute for Justice and Reconciliation (IJR) observed that: "by 2006 there was evidence of a systemic failure (of) the water treatment/sewerage system in Cape Town".[4]
What had gone wrong? A decade earlier, a study by the Cape Town City administration had found that in water and sanitation, there was "a sound overall infrastructure".[5] These advantages had been frittered away. The INJ report remarked: "officials have failed ... to give sufficiently forceful advice to politicians. Politicians have rejected technical reports and diverted funds to other uses".[6]
It must be remembered that the provision of clean water and sanitation is not simply another function of modern local government but, historically and in principle the very core reason for its existence. Poor roads and failing electricity are a problem; but at the same time neither threatens to destroy whole communities through the spread of deadly infections. That was the concern that prompted the City of London to abolish a chaotic medieval system of parishes and replace them with the first modern metropolitan government body, the Metropolitan Board of Works in 1855. The need to clean up London was vividly confirmed three years later when "The Great Stink" horrified Londoners during the hot summer of 1858. In 2006 Cape Town faced the prospects of its own Great Stink.
Cape Town's crisis was a direct product of maladministration. The outgoing administration had treated the city as an inexhaustible source of resources, almost entirely ignoring the basic obligation to maintain a system in order to ensure, at the very least, that what it delivers today it can do just as well tomorrow. In 2009, the City's own assessment of its Integrated Development Plan looked back and argued:
"The replacement, rehabilitation and preventative maintenance of existing infrastructure (had) suffered as a result of the persistent focus on the (often reactive) extension of infrastructure".[7]
In other words, the pre-2006 city government thought it could keep extending services without replacing or repairing an increasingly strained infrastructure. Cape Town, as South Africa's oldest city and the owner of some of its most aged infrastructure, desperately needed careful management. From 2002 to 2006, no more than 7km of old water pipe was replaced against an estimated minimum requirement of 160km.[8]
In a famous definition, the British parliamentarian Richard Crossman defined maladministration as "bias, neglect, inattention, delay, incompetence, ineptitude, perversity, turpitude (and) arbitrariness".[9] Many of these adjectives apply to the repair and maintenance of Cape Town's water and sanitation infrastructure in the four years to 2006. But water and sanitation were only the tip of the iceberg.
The sad fact is that in 2005/06, Cape Town spent less than 60% of its operating and capital budgets, marginally down from the previous year and the worst of all metropolitan governments in South Africa by a wide margin.[10] In the same period, Johannesburg, eThekwini and Tshwane all spent well over 90% of their budgets. This didn't stop the municipal regime rewarding itself handsomely. The State of the Cities report (2006) noted disapprovingly: "Despite the poor performance, Cape Town had the highest paid city manager of the nine (largest South African) cities in 2004/05, earning R1, 104-million".[11]
Failure to spend a local authority budget is certainly not a tribute to prudence. It is in fact a savage indictment of the incapacity of the municipal regime generally and its political managers in particular. It meant that the problems with water and sanitation were replicated across the entire range of municipal services. Road maintenance and new construction, the creation of a metropolitan transport system, the replacement of 30 to 40 year-old electricity distribution infrastructure, the Metro government's responsibilities in providing housing for the poor[12]; Cape Town was faltering in all these areas.
Corresponding to the city's demonstrable inability to spend was a similar collapse on the revenue side of the budget. By 2006, Cape Town's debtors owed the city R4 billion in unpaid rates and service charges.[13]
Where did this extraordinary incapacity originate? In 2008, the new mayor spelled it out:
"Why (was this)? A previous administration, losing sight of its mandate, decided to strip this city of skills in pursuit of something called ‘transformation'. For (the current administration), the purpose of transformation must be to ensure excellent basic services to all ... When that goal is replaced by racial head-counting, real, broad-based empowerment will never happen".[14]
While hard numbers taken from the City budgets of 2004 to 2006 tell a tale of woe, in many respects it was the impact on "soft," human resource-based services that was most significant. Through under-investment and the political manipulation of human resources to create opportunities for "deployed cadres", both the City's Fire and Rescue Service and its Metro Police had been crippled.
It need hardly be said that municipal fire services are critical in any local authority. However, Cape Town's Mediterranean climate renders the city particularly vulnerable as late summer and early autumn follow six months of bone-dry weather. Cape Town's 223 informal settlements, home to 15% of the city's households, are particularly vulnerable.[15] The widespread use of paraffin stoves for cooking, making fires for warming shacks and the use of candles for lighting all contribute to the hazard.
Yet in 2006, the incoming administration found a Fire Service in tatters. It possessed only 45% of the resources required to operate and what equipment it had was decrepit. The oldest fire tender was 45-years old and had almost 1 million km on the clock.[16] The department had endured 3 years of budget starvation - R4m (2003), R8m (2004) and R11m (2005) - and had a staff compliment of only 450 against the minimum requirement of 800.When the new member of the mayoral committee for emergency services made a surprise visit to a fire station, a fire-hose was rolled out to provide a practical demonstration. It proved to be so full of leaks so as to be unusable.
In the summer of 2005 this neglect came home to roost. In that year approximately 6 300 informal Cape Town dwellings were consumed by fire. Afterwards, there were only about 100 instances where dwellings could be assessed as "damaged" rather than "destroyed". As "damaged" often (although not always) reflected a successful Fire Service intervention, the 2005 ratio of 63 dwellings destroyed for every one damaged indicates a woeful inadequacy on the part of the authorities. While it is true that every fire is different, the statistics over a five year period indicate a growing problem.
Fires in informal settlements:
Numbers of dwellings affected
|
Year |
Destroyed |
Damaged |
Ratio |
|
2001 |
1000+ |
900 |
1,1 : 1 |
|
2002 |
1700 |
700 |
1,4 : 1 |
|
2003 |
2100 |
500 |
4,2 : 1 |
|
2004 |
4400 |
1800 |
2,4 : 1 |
|
2005 |
6300 |
100- |
63 : 1 |
City of Cape Town Sustainability report 2006: Summary
That summer, Table Mountain itself was engulfed in fire. Virtually every fireman in the City had to be deployed to fight it, leaving the rest of Cape Town dangerously vulnerable. An official commented later: "never mind the ‘Big Stink'; we almost had our own ‘Great Fire'".
The Metro Police service, for its part, had only 1 786 of its budgeted 2 400 staff, suffered from severe shortages of both equipment and specialised skills, and had a reputation for corruption and inefficiency.[17] The fact that the senior Metro officer, a political appointee with no on-the-beat experience, insisted on being called "general", appeared to have little positive influence on efficiency.
When the period immediately prior to 2006 is analysed, one consistency emerges: maladministration defined in terms of one or more of the Crossman-esque adjectives: "bias, neglect, inattention, delay, incompetence, ineptitude, perversity, turpitude and arbitrariness". There is of course a corollary to this gloomy picture: the worst consequences of inadequate city government are suffered by the poor. It is they who have no alternatives when services break down, promises to deliver houses are not kept, officials are unresponsive and drug lords come to dominate neighbourhoods.
One further set of consequences deserves attention. The administrative chaos - which will be described in more detail later - opened a wide gap for corruption. The post-2006 administration found that there had been numerous irregularities in the award of contracts under the previous regime. Under the previous administration, the municipal tender system had become a patronage machine for well-connected individuals and party loyalists.
As a consequence delivery was poor at best, and when it did happen, it was at unacceptably high prices as middlemen raked off a cut. One senior official was known throughout the City as "Mr Ten Percent", a comment on the cost of his "facilitation" fee. He operated with impunity throughout the period in office of the pre-2006 regime, openly in cahoots with politicians and other senior officials.
The New Administration's Promise
The new administration, elected by the people of Cape Town in April 2006, had a very different philosophy of governance to its predecessor. It believed that growth and development are compatible but only if they are underpinned by effective administration.
In the words of the incoming mayor:
"(Cape Town) has (both) major development challenges...and a vibrant and growing market economy. Some see these as making up two worlds in one city, worlds that will never meet. But there does not have to be a contradiction between economic growth and social development ... economic growth, led by investment, is one of the best ways we can improve the lives of all the people of Cape Town, especially the poor. The challenge for us as a city is to facilitate this ...and we must find ways to ensure that the market works well for the poor".[18]
The philosophical basis of Cape Town's turn-around was the concept of the Open Opportunity Society for All. This is a society in which all South Africans are free and equal in rights, and in which each has the opportunities to go as far as their talents and ambitions will take them, and in which every South African has the space to be whatever they wish to be. As the new City government proceeded to demonstrate from 2006 onward, the Open Opportunity Society for All is not simply an abstraction but a practical basis for goal-setting and action.
The new administration undertook to run a number of processes in parallel. Some actions were immediate responses to the unfolding crisis. These included:
- A re-capacitation of administrative structures, especially project management capacity;[19]
- Emergency budget allocations to particularly run down departments. In its first 100 days, the new administration allocated R56.8 million to fund critical posts in the City, particularly for nurses, fire-fighters and police services;
- Another R31-million was allocated for capital expenditure in the Metro Police and Traffic and Licensing Department.
- Getting a grip on the City's finances, cutting its external debt and collecting revenue.
- The City drew up plans for a Job Centre project to be established in Nyanga, allocated an additional R3.8m for various parks and cemetery projects and established a special committee to deal with the plight of the homeless.[20]
But the incoming administration promised not only more efficient governance, a pre-condition of the Open Opportunity Society for All, but also a longer-term (5-year) plan to leverage opportunity. The primary thrust of this plan was to use Cape Town's capital budget, including the special transfers due to come through to finance the FIFA 2010 World Cup and related infrastructure, to maximise opportunities for its residents. As Dan Plato, later Executive Mayor, remarked:
"Ultimately, the primary goal is to promote infrastructure-led economic growth that will create jobs and attract investment to Cape Town".[21]
Above all, the guiding principle of infrastructure-led growth meant giving attention to the ordinary tasks of local government; better roads, reliable electricity, adequate water and sanitation and a clean, safe public environment. "If we don't do this, we rob our citizens of their opportunities to improve their lives, especially the poor", said then mayor Helen Zille.[22]
It is worth pointing out the fundamental assumptions behind this approach. The incoming administration believed that the biggest test of local government is through getting a very delicate balancingact right. On the one hand, it has to extend the provision of services to the poor; on the other, it has to maintain an enabling environment in which business can invest and create jobs. It is a delicate balancing act and only a capable administration, led by people dedicated to the welfare of the entire city, have any chance of pulling it off.
The Results: A City that Works
Administration
Cape Town's pre-2006 city regime had signally failed to consolidate the seven separate administrations that were brought together to form the Cape Town Metro in 1999/2000. A preoccupation with senior deployments as part of a political reward or "spoils" system had left the administration incoherent, leaderless and low in morale. Staff reporting lines were not in place, performance monitoring entirely ineffective and unequal conditions of service and salaries, an inheritance from the old administrations, remained in place.[23]
The incoming administration could not even find a proper organogram to explain how the various components of the city were meant to fit together. Challenged on this omission, a senior political appointee asserted that "the structure will become clear when the right people (read "deployees") are in place."[24] The incoming administration was forced to prioritise an enormous process of organisational redesign.[25]
One of the major problems was that political deployments had almost gutted capacity at the top three levels of administration. There was a major shortage of skills, especially hard technical skills and as a consequence, a debilitating loss of institutional memory. The City's Chief Engineer had been replaced by a man whose qualifications were in the sphere of human resources. At levels 2 and 3 in the administration, the post of City Legal Advisor was in effect replicated four times. The collapse in administrative effectiveness was, however, accompanied by a R250m increase in the salary bill at senior levels.[26]
Reorganisation took more than two years. It had to be conducted in parallel with a revision of the City's Integrated Development Plan (IDP). By 2007, the IDP had been structured into themes, each with objectives and interventions which could be used as a framework to direct budget, human and other resources. [27] In March 2006, the Metro's 23 sub-councils were approved. A year later, staff integration had been largely completed at the operational level and 1 800 new staff, mostly technical personnel, had been employed.[28] In 2006/07, Key Performance Indicators and City Manager's targets were set and the process of "cascading" these down to all directorates began.[29] It was completed in 2008.
Undoing the faults of the past is never painless and City management and administration requires maintenance just as much as infrastructure. In some ways it is a never-ending process. Nevertheless, in 2009, the Cape Town City manager Achmet Ebrahim was able to state that the city administration was "ready to roll up its sleeves and get its hands dirty in order to deliver on the needs and expectations of all citizens of Cape Town".[30] Of the 300 managers displaced by the amalgamation of administrations, an issue never dealt with by the previous regime, only four remained without proper positions by May 2007.[31] In 2008/09, the City was not only able to spend 95% of its staff training budget, compared to the previous administration's average of 80% in its last two years, but the training itself was purposeful and aligned with the city's goals. A standard annual survey to index staff loyalty showed a 25% increase that year.
Finances
Evidence for the massive improvement to the City as an administrative and delivery machine is not based only on soft indicators, however. It is the reform of Cape Town's finances that most clearly tells the story of successful reform. In its 2010 report on Cape Town, international ratings agency Moody's felt able to conclude that: "The City of Cape Town is rated at the high end of the five metropolitan municipalities rated by Moody's in South Africa".[32]
The Moody's report added that, "the city adheres to prudent strategies in financial, debt and liquidity management ... A well-established and focused management team provides stability to the City's strategic planning and operations. Budget execution and cash flows are regularly monitored and the administration is committed to reinforce internal controls".[33]
The woeful inability of the pre-2006 administration to spend it budget has been referred to previously. However, if anything, the negative implications have been understated. In the three financial years prior to 2010, Cape Town, like other FIFA 2010 host cities in South Africa, was due to receive a massive series of transfers from the National Treasury, not only for the construction of the new stadium but also for other key areas of infrastructure such as transport. If the City had continued on its downward spiral for much longer, there can be little doubt that it would have been embarrassed in the eyes of the world during the FIFA 2010 event.
City officials today are modest about spending almost the whole budget. It is only what should be expected of an effective metropolitan administration, they suggest. Nevertheless, as the table below indicates, it has been a long and painful process.
City of Cape Town: Capital Expenditure 2002-2010
|
|
2002/03 |
2003/04 |
2004/05 |
2005/06 |
2006/07 |
2007/08 |
2008/09 |
2009/10 |
|
Budget |
1,970 |
1,360 |
1,506 |
2,130 |
2,545 |
4,000 |
4,000 |
6,200 |
|
Proportion spent |
67,8% |
66,5% |
63,2% |
71,4% |
77,4% |
78% |
96.5% |
83% |
All figures = R ‘000,000
SOURCE: City of Cape Town Annual Reports 2006/072010/11
But effective spending involves far more than simply freeing up funds to be allocated. It is a delicate task that involves expenditure prioritisation (with the choices and trade-offs involved), debtor management and balancing borrowings against investment. Within a year of taking over the City, the new administration had managed to cut debt by nearly R1bn. That allowed it to extend the capital available for service delivery by 15%. It also wrote off debt for the very poor to the value of R15-billion. Investment in infrastructure that benefits the public and supports the economy rose from R950m in 2004/05 to R3,1 billion in 2008[34] and 3,5bn in 2010/11[35], an increase of over 300%.
Under the previous City regime, Cape Town had spent R5bn on infrastructure over five years. In a similar time period, the post 2006 City government spent R19bn. It tripled spending on repairs and maintenance from R800m/year to R1,6bn/year.[36]
On the revenue side of the budget, Cape Town faced a common South African problem; non-payment for rates and utility services, not only by households and businesses but also government departments. In a context of scarce resources it is particularly important that households are subjected to the linkage between disciplined parsimony and lower costs. That link is the only incentive for household savings. The City of Cape Town sent out over 300 000 "pink slips" - the final demand notices to defaulters - and by 2010 had raised its collection rate to 96%.[37] Collection was never brutal; strict enforcement only happened once a package of rebates was available, the City's Indigents policy had been overhauled and pro-poor subsidies were in place.[38] So sensitively was this handled that 16% of the poorest households in Cape Town experienced a reduction to their municipal account in 2006/07.[39]
Openness and Accountability
The contrast between the secrecy, cronyism, murky insider deals of the regime prior to 2006, and the openness and accountability of the current City administration is stark. The previous regime acted as if it believed it had the right to appropriate public monies for private use. But the post-2006 City administration was elected on a promise to clean up municipal government. The motives were both a matter of principle and practicality. Helen Zille argued that "the first and most essential requirement for productive enterprise is the rule of the law and clean, honest, open government".[40]
By inhibiting investment, corruption also undermines development. Helen Zille said: "Corruption sabotages the economy, steals from the taxpayer and kills the hopes of the poor".[41] In 2006, the new administration threw the doors open. All council meetings and Mayoral Committee meetings were opened to the public. So too were all meetings of the Bid Adjudication Tender Award Committee which decides all contracts between the City and outsider suppliers.
Within the municipality, things were also opened up. Scrutiny was enhanced by the creation of a Standing Committee on Public Accounts (Scopa), the first in any South African municipality. The municipal Scopa is modelled on its national parliamentary counterpart of the same name and, like the parliamentary committee, is chaired by a member of an opposition party.
Reform of the City tender process has produced some extraordinary outcomes. The previous City regime had applied Black Economic Empowerment criteria far in excess of legal requirements. The effect was to gravely restrict the number of companies eligible to supply the City; combined with tender irregularities, this saw the same insider group rewarded time after time. The post-2006 City government took legal advice (from the State Law Advisor and National Treasury), revised the criteria and decided to actively manage the supplier database. Between 2005 and 2010, the number of small businesses on the City's supplier database increased from 10 000, many of which were inactive, to 16 677[42]. This included a considerable increase in the number of small black-owned firms doing business with the City.[43]
Since the reforms, every tender valued at R2 000 or more is advertised on the City's website. Active management includes things like SMS reminders to all suppliers a month in advance of their tax clearance certificates falling due, as well as other notifications.
The City's accountability is enhanced by the use of state-of-the-art information technology by a motivated staff complement. The City's IT system is a world-wide reference site for SAP.[44] One of the important applications of the system is managing complaints from members of the public. These are now automatically logged and recorded. Each file can only be closed when the complaint has been dealt with. This is not only good for customer responsiveness but feeds through to the financial management of the City too. A series of complaints about the same water pipe would suggest that it is due for replacement.[45] In 2009/10, the City's call centre answered 926 253 calls, all in the language of the customers' choice.[46]
A City that works for the Poor
From the outset, the post 2006 City government has been especially concerned that good municipal governance benefited the poor and marginal. Unlike its predecessor, it took on board one of the primary international development lessons of the past 30 years: the transfer of resources to the poor all too often degenerates into patron-client relationships. One of the conceptual pillars of the Open, Opportunity Society for All is the understanding that when individuals become political ‘clients', they cease to be citizens.
Cape Town's former Executive Mayor said: "We cannot resolve the crises of poverty and inequality by extending state patronage to selected beneficiaries".[47] Instead, it is imperative to meet basic needs and thereafter to facilitate an incremental process of assisted improvement. The new City government set out to expand opportunities for the poor rather than turning them into perpetual dependency on state delivery.
While turning around a City on a path to self-destruction, the post-2006 administration undertook not to cut spending on the social services that benefited the poor. Despite the pressures that came with the need to rectify the previous regime's mismanagement, social spending in 2006/07 was maintained at the same level - R385m for free water, subsidised housing and electricity.[48] Thereafter, savings and efficiencies achieved within City administration allowed ever increasing sums to be spent on this category spending: nearly R500m in 2007/08[49]; 586m in 2008/09[50]; and R776m in 2009/10.[51] Perhaps more important has been the matter of focus: the post-2006 City government established a dedicated budget to deal with these issues.
No account of the City of Cape Town's efforts to accommodate its poor would be complete without mention of its Indigent Policy. The policy was overhauled by the new City administration in 2006/07. It dramatically expanded the qualifying group and improved benefits, thereby providing relief not only for the jobless but also for the category sometimes called "the working poor".
The Indigent Policy caters for residents who are genuinely unable to afford state and service charges. Once registered, they qualify for a 100% rebate on rates, 6 000 litres of free water a month and 50kWh of free electricity/month. All residents who own properties valued at less than R199 000 qualify, a vast improvement on the minimum threshold of the R88 000 under the previous city regime. Political opponents have alleged that the City cuts off poor people for non-payment. This is nonsense. The system works so that everyone in the city gets 6 000 litres free. Those who register as indigent then qualify for another 4 500 litres.[52]
The problem of poverty is enormous: Some 40% of City households live below the poverty line[53] and the housing shortage is demonstrated by a housing waiting list nearly 400 000 strong.[54] In 2006, the City had 105 000 shacks.[55] 18 000 new poor households get added to the urban community every year, a result of in-migration mostly from regions of failing service delivery. The development issue has a massive spatial component with the poor living not only without adequate services and housing but also in urban locations far from economic opportunities.
The City's focus on infrastructure-led growth has not compromised delivery to the poor. On the contrary, Cape Town has delivered more to its poor than any other city in South Africa. In October 2009, BEE ratings agency Empowerdex found that "Cape Town is clearly the best city in the country for service delivery".[56] The Index, which considers housing, water, sanitation, electricity and waste removal, combines figures for the current status of household access to services with an improvement index over six years. This matches studies by other reputable companies. The table below was produced in 2009 by Global Insight, one of the two premier economic data providers in South Africa. It measures household access changes against four indicators: Water, sanitation, refuse collection and electricity.
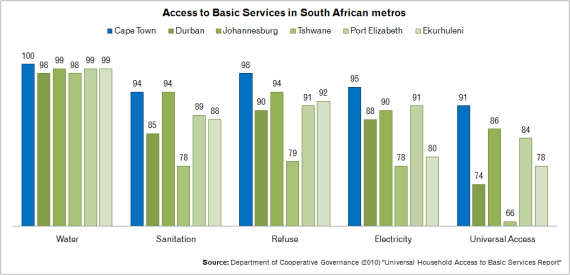
Perhaps the most important published opinion of all is that presented in the Universal Household Access to Basic Services Index (UHABS) produced by a project co-funded by the Department of Cooperative Government and Traditional Affairs (CoGTA). The study found that of the 24% of Cape Town households that live below its defined poverty line, an effective 100% (i.e. over 99.5%, rounded to the nearest whole number) had basic access to water and 91% "higher access".[57] In sanitation, 94% had basic access and 93% "higher access".[58] In refuse collection the figures were 98% basic and 94% higher; in electricity both figures are 95%. By 2010, the City of Cape Town had achieved an effective 100% coverage in both water provision and refuse collection.[59] The UHABS report rated Cape Town at the very top of the ranking of district and metropolitan municipalities in South Africa.[60] These are highly notable achievements that belie any sort of claim that the city's focus on growth implies a neglect of the poor.
When the post-2006 City administration was elected, the backlog in water provision was 30 000 households.[61] However, it should be remembered that with in-migration of 18 000 new households every year, service delivery is a moving target. Furthermore, numbers are rounded off to the nearest whole digit, so the most honest way of presenting Cape Town's achievements in water provision and refuse collection is to state that fewer than half of one percent of households do not now enjoy access to these services.
One very considerable difference in the approach to the problem is that while the pre-2006 City administration made some attempt to connect the poor to services, the present City administration has both accelerated connection and, more importantly, tackled the problem in a holistic manner. At issue is not simply a lack of resources and infrastructure but also the set of problems that come with poverty, marginalisation and urbanisation, including criminality, sexual exploitation, substance abuse, HIV-AIDS and other epidemic diseases, malnutrition and, perhaps most dangerous of all, the absence of hope for a better life. At the same time, it was clear that the vast majority of Cape Town's poor are capable, aspiring urban citizens, needing opportunity above all. The City's second Annual Community Satisfaction Survey, conducted between November 2008 and February 2009, found that the two priority issues were, by overwhelming margins, job creation and crime prevention.[62]
In November 2007, the City approved an Informal Settlement Master Plan Framework "which aims to integrate informal areas within the broader urban fabric to overcome spatial, social and economic exclusion".[63] Together with the City's Integrated Development Plan and its Spatial Development Framework, this constitutes a macro management tool for determining the allocation of resources by the City. The two largest zones of deprivation - Khayelitsha and Mitchell's Plain - have provided a special focus. Khayelitsha, in particular, has been the target not only of a massive Urban Renewal Project (URP) but also of the City's own initiative, Violence Prevention through Urban Upgrade (VPUU), in partnership with the German government. [64]
With a population of 800 000, Khayelitsha is South Africa's third largest township.[65] Only about 30 years old and one of the ugly step children of apartheid spatial planning, whatever urban order once existed in Khayelitsha had been overwhelmed by the establishment of 67 000 informal households. Once dubbed "the rape capital of the Western Cape"[66], the township was targeted for an innovative development programme, initiated in 2006.
Planning has at every step been based on the participation of the community. It has set out to simultaneously change both the urban landscape and the lives of ordinary people. It centres on four "safe nodes" where neatly paved walkways, regularly spaced streetlamps, public squares and multi-functional modern public buildings have replaced informal sprawl. The community is involved in the staffing of "active boxes" which provide an early warning system for spotting criminal activity. At the same time, the City has invested resources in promoting small business, building sports complexes, schools and libraries, and sponsoring more than 80 community projects. All of this activity occurs within a context of transport upgrades with R300m going into a local extension to the urban rail network.
The City has worked hard to promote business and bring investment to the area. It has spent R451m laying out, providing services and constructing public buildings in Khayelitsha's new Central Business District. The development is gaining momentum. In the last two years Khayelitsha has attracted huge shopping mall investments by Liberty Properties and Pick ‘n Pay. The City is now developing tourism facilities on a stretch of False Bay adjacent to the township, in order to open up both business and recreational opportunities for residents.[67]
The housing record of the post-2006 City government demonstrates a similar effectiveness in servicing the poor. Only certain aspects of housing are a local government function and some of the City's achievements might seem straightforward. However given the chaos inherited from the previous City regime, cleaning up the administration was a Herculean task.
One of the biggest problems was consolidating the 334 000 person strong housing waiting lists and, what is more, doing so in a way that was fair. These lists had become a notorious scandal as some individuals appeared several times, others jumped the queue (often by bribing their way ahead) and there were many cases of misrepresentation, usually of income, by individuals determined to qualify. Attention was given first to those who had waited longest - in one case since 1968 - and to applicants with special needs. By eliminating geographical allocations, the City was able to produce a consolidated list, where a person's placing indicated when they were likely to get a house.[68]
Even though the post-2006 City government has built three times the number of houses its predecessor managed, the growing rate of demand has meant that the housing backlog remains high. In order to address this, the City of Cape Town has adopted a number of innovative strategies. It has started to emphasise in-situ upgrades, where land is transferred at no cost to the new landowner who then, as a result of ownership, has an incentive to improve the property. This approach has considerable advantages. For any particular sum of money, it allows transfer of four times as many properties as the RDP housing system. As a result, it gives four times the number of people a stake in both urban life and the modern economy.
Very soon after coming to office, the new City administration negotiated an agreement with three major banks to finance housing loans for "Gap housing" - i.e. families who earned between R3 000 and R7 500/month and who thus qualified for neither state assistance nor mainstream market housing finance. Since the end of 2008, 12 sites for GAP housing projects have been put out to tender; by late 2010, top structures were being erected on two of them. [69]
The City of Cape Town's achievements since 2006 are extraordinary. The city has had to make up an organisational and capacity backlog almost as daunting as South Africa's notorious development backlog. It has managed this immense task because its post-2006 leadership has viewed it as an exercise in prudent stewardship, one very different to the widespread tendency to treat metro governance as a process of handing out rewards.
In 2006, Cape Town was a city in danger of drowning in its own waste. In fact, it had effectively lost control of all its services. Water demand management, a critical aspect of governance in a water stressed area, had been going rapidly backwards for four years. The metro police and fire service were demoralised, under-resourced and incapable of dealing with the demands on them. There was a danger that the city's informal settlements would burn to the ground; in poor and working class suburbs, the drug lords effectively called the shots. While new connections to services had been delivered under the previous regime, the service and maintenance backing that makes those connections sustainable had almost entirely imploded. The poor were being short-changed. They faced every prospect of becoming an addition to one of South Africa's saddest development statistics: over half of the country's new water connections become inoperable within five years thanks to inadequate operations and maintenance.[70]
Cape Town's Central Business District is the best maintained, cleanest, safest and simply the most viable in the entire country. An innovative and ongoing public-private partnership with a local business-backed NGO, the Cape Town Partnership, has seen violent crime in the CBD decline by 90% in five years.[71] Cape Town has a higher proportion of Metro Police engaged in real policing than any other metropolitan government in the country.[72] [There were 955 arrests for drug-related crimes in 2009/10, a dramatic increase from the 180 or so for 2005.[73] Cape Town has also reintroduced the specialised units - for substance abuse, land invasions, metal theft and displaced persons - that the SAPS so unwisely disbanded several years ago. It has the largest CCTV footprint in Africa and continues to expand this, investing R10m/year[74].
Primary health is a local government function and the City runs 92 of the 99 Primary Health Care facilities in Cape Town. In this area, Cape Town's achievements have been significant. The City's Infant Mortality Rate improved from 25.2 in 2003 to 20.8 in 2009[75], in a context where the national rate has declined (to about 50). The Tuberculosis Smear and Cure Rate has shown a steady improvement from 70% in 2005 to 78% in 2008. The most recent figures, for January 2011, show an 80% cure rate, the best of any metropolitan area in South Africa. In 2010, four million patients attended City Health facilities[76]. In 2010, nearly half the cervical cancer screens in Cape Town (20 908 Pap Smears) were conducted by City Health.
Cape Town is a city where traffic lights work and potholes get repaired. The City was recently able to turn down an offer from a large South African company that sponsors emergency pointsmen - who direct traffic when robots fail in other metros - because there was no need for this form of corporate social investment.[77] Moreover, Cape Town is a city of happy municipal employees: Since 2006, absenteeism among city employees has been halved to 4.9%[78]; staff satisfaction surveys show an increase in morale of over 50% since 2006; and the City no longer struggles to fill key positions. It need hardly be pointed out that job satisfaction makes quality service more likely.
Cape Town is clean both figuratively and literally: In 2007, Cape Town was awarded the Department of Environmental Affairs and Tourism's annual Cleanest Metro award. At 98%, the City had the best Blue Drop (water purity) rating of all metropolitan governments in South Africa in 2010. It was also the first city in the country to develop an information system capable of providing water quality assurances in real time. Maintenance, better bulk metering and ongoing pressure management now constitute an effective demand management system.[79] Managing water demand downwards requires consistent and effective management over a long period of time; it is not a glamorous job with quick wins. In 2009/10 Cape Town reduced overall demand for water by 26,8% for the year, well in excess of the 20% target agreed to with the national Department of Water Affairs.[80]
Cape Town is the first and, at the time of writing, only South African city to enact an Air Quality Management by-Law (in March 2010). The benchmark is provided by the World Health Organisation's (WHO) guidelines. The City has invested in a number of testing stations to constantly monitor the quality of air, especially around zones of traditionally high pollution. Over the 2010/11 financial year, air pollution has exceeded WHO guidelines on only 111 days, down from 165 days the previous year.[81] City management has expressed its determination to drive the figure downwards, getting it as close to zero as possible.
Better administration allows greater opportunity and thus maximises the chances of adding to the net sum of human happiness. The numbers all indicate that the City of Cape Town has become a unique animal among South African metros: A government that delivers a better life to all its residents by carefully balancing growth and redistribution from a base of institutional sustainability. But do most residents of Cape Town recognise this? There is every sign that they do.
The City has commissioned annual community satisfaction surveys for the past 3 years. Conducted by leading independent experts, and intended for management information, the surveys have found a steady upward trend in perceptions of City government performance since 2007.
In 2009/10, 57% of Cape Town residents said that overall the City's performance was good, very good or excellent, up from 54% in 2008/09 and 50% in 2007/08. 57% were equally positive in rating the City's "role as a public service provider", up from 54% in 2008/09 and 46% in 2007/08. 66% of interviewees rated their "trust" in the City as "fairly strong, very strong or extremely strong" in 2009/10, up from 61% in 2008/09 and 50% in 2007/08. In only one area was there a notable decline over the 3 years: the affordability of electricity, a product of national government mismanagement. The methodology of the surveys has remained the same across the three years, meaning that the outcomes are comparable.
These are the opinions of 3000 citizens who know that their city is moving in the right direction. As the Cape Town Story, recounted above, shows, "the right direction" doesn't just happen by chance. It has to be deliberately chosen and then relentlessly pursued, day-in and day-out. It is a mature style of government, founded on the understanding that good governance is directed towards facilitating opportunities. The overwhelming consideration is that government is able to do tomorrow what has been done today, at least as well and preferably better. The achievement of that "better" end is the Cape Town Story in a nutshell.
BIBLIOGRAPHY
Brookings Institute and London School of Economics (2010), Global Metro Monitor
Cape Argus (2005) "Sewerage crisis looms over central Cape Town", 29 September
Cape Times (2006) "City's sewage effluent often fails national standards", 22 June
City of Cape Town Annual Report 2009/10
City of Cape Town Annual Report 2008/09
City of Cape Town Annual Report 2007/08
City of Cape Town Annual Report 2006/07
City of Cape Town Budget 2010/11 - 2012/13
City of Cape Town (2009) Community Satisfaction Survey
City of Cape Town (2010) Five Year Integrated Housing Plan 2010/11 - 2014/15
City of Cape Town (2010) Five year Plan for Cape Town: Integrated Development Plan (IDP) 2007-2012
City of Cape Town (2007) Water Services Development Plan
CMA (2003) Interim Metropolitan Development Framework: The way forward [Draft Report]" 14 December
CSIR (2007) The State of Municipal Infrastructure in South Africa and its Operation and Maintenance: An Overview
Department of Cooperative Governance and Traditional Affairs (2009a) The State of Local Government in South Africa
Department of Cooperative Governance and Traditional Affairs (2009b) Basic Services Publication: Comparative Information on Basic Services
Empowerdex (2009) Service Delivery Index
The Law Commission (2008) "Administrative Redress: Public Bodies and the Citizen" Consultative Paper No 187, United Kingdom
Moody's Investor Service (2010) Credit Opinion Cape Town, City of, 18 June
Moody's Investor Services (2008) Credit Opinion Johannesburg, City of, 12 December
National Treasury (2010) Operational and Capital Expenditure Analysis
National Treasury (2008) Local Government Budgets and Expenditure Review
Nicol, M. Gubeni, Z. and Makgamathe, L. (2006) "Overflow and Outages: Mismanagement of Utilities in Two Cities" (in) Brown, S. (ed) Economic Transformation Audit: Money and Morality (Cape Town: The institute for Justice and Reconciliation)
Nielsen, Ian (2010) Open Opportunity Society for All: Procurement, presentation
Palitza, Kristen (2010) Urban Renewal Reduces Crime in South African Township, IPS
Penning, Victor (2010) Mismanagement lands Joburg in financial fix, press statement, 2 March
SA Cities Network (2006) State of the Cities Report
SA Cities Network (2010) Overview of the Financial State of the Cities 2010, Presentation, 5 August
Slamdien, Fadela (2010) "From Rape Capital to Safe Capital", Western Cape News
The Social Housing Foundation (2010) Social Housing Trends, March
Stats SA (2010) South African Statistics 2010
Stats SA (2007) Community Survey
Stats SA (2009) Labour Force Survey
Stats SA (2009) General Household Survey
Stats SA (2001) Census data
Support Programme for Accelerated Infrastructure Development [SPAID] (2009) Universal Household Access to Basic Services (UHABS)
South African Institute of Race Relations (2009) Local Government and the Poverty Challenge
Vos, James (2011) Report for Health Portfolio Committee, City of Cape Town, 4 January
Zille, Helen (2008) Budget Speech, 2008
Zille, Helen (2008) Budget Speech, 2007, 30 May
Zille, Helen (2006) Speech to the Cape Chamber, July
Zille, Helen (2008) Speech at the Khayelitsha Development Forum, May
Zille, Helen (2009) The ANC is pro-poverty, not pro-poor", SA Today
APPENDIX 1
THE CAPE TOWN STORY
Basic and development data
|
|
Population |
Area (Kms) |
Budget 2010/11 (Rbn) |
GGP as % of GNP |
Households
|
|
Cape Town |
3,7m |
2 500 |
23 |
10.9 |
1 002 865 |
|
Ethekwini |
3,46m |
2 300 |
24,1 |
8.1 |
946 314 |
|
Johannesburg |
3,9m |
|
26,3 |
15.9 |
1 298 310 |
SOURCES: Stats SA 2009 Household Survey, City of Cape Town Strategy and Planning Unit, IHS Global Insight, Durban Investment Promotion Agency, Johannesburg MTEF 2010-12, Budgets of all 3 cities 2010/11
DEVELOPMENT DATA
BASIC SERVICES PER METRO 2009
|
Metro |
Water % |
Sanitation % |
Refuse % |
Electricity % |
Universal Access* %
|
|
Cape Town |
100 |
94 |
98 |
95 |
91 |
|
Ethekwini |
98 |
95 |
90 |
88 |
74 |
|
Johannesburg |
99 |
94 |
94 |
90 |
86 |
|
Tshwane |
98 |
78 |
79 |
78 |
66 |
|
Port Elizabeth |
99 |
89 |
91 |
91 |
84 |
|
Ekurhuleni |
99 |
88 |
92 |
80 |
78 |
SOURCE: SPAID, UHABS 2009
*Universal Access is a composite index developed by SPAID, aggregating figures from several service delivery categories including those listed here
POVERTY AND DEPRIVATION RATES 2007
|
Metro |
Poverty Rate % |
Deprivation Rate
|
|
Cape Town |
32 |
1.6 |
|
Durban |
41 |
1.8 |
|
Johannesburg |
32 |
1.6 |
|
Tshwane |
28 |
1.9 |
|
Port Elizabeth |
41 |
1.6 |
|
Ekurhuleni |
37 |
1.8 |
SOURCE: SAIRR 2010
This uses the Statistics SA definition of the poverty rate: the proportion of households in a municipality that had a monthly income below R800 in 2007.
The deprivation index is a composite measure derived from a set of demographics and socio-economic variables. These include type of housing, access to water, electricity, and sanitation among other services. It is on a scale between one and five, whereby five indicates the highest level of deprivation in a municipality.
2010 WATER QUALITY
|
Metro |
Blue Drop Score |
|
Cape Town |
98 |
|
Durban |
96 |
|
Johannesburg |
98 |
|
Tshwane |
96 |
|
Port Elizabeth |
95 |
|
Ekurhuleni |
97 |
|
SOURCE: Department of Water Affairs |
|
PROPORTION OF PEOPLE LIVING IN POVERTY
|
Metro |
Poverty Rate |
|
Cape Town |
20 |
|
Durban |
31 |
|
Johannesburg |
22 |
|
Tshwane |
18 |
|
Port Elizabeth |
33 |
|
Ekurhuleni |
28 |
SOURCE: SAIRR 2010
Statistics SA defines the poverty rate as the proportion of households in a municipality that had a monthly income below R800 in 2007.
TYPES OF HOUSING
|
Metro |
Formal Housing |
Informal |
Traditional & Other |
|
Cape Town |
83 |
16 |
1 |
|
Durban |
72 |
17 |
11 |
|
Johannesburg |
77 |
19 |
4 |
|
Tshwane |
71 |
27 |
2 |
|
Port Elizabeth |
85 |
14 |
1 |
|
Ekurhuleni |
71 |
26 |
3 |
SOURCE: SPAID, UHABS, 2009
PIPED WATER 2007
|
Metro |
% of households with water piped inside |
|
Cape Town |
81 |
|
Durban |
62 |
|
Johannesburg |
70 |
|
Tshwane |
63 |
|
Port Elizabeth |
71 |
|
Ekurhuleni |
65 |
SOURCE: SPAID, UHABS, 2009
ECONOMIC PERFORMANCE
CHANGES IN GROWTH AND EMPLOYMENT
|
|
Pre-recession (1993-2007) |
2007-2010 |
||
|
|
Annual change (%) |
Annual change (%) |
||
|
|
INCOME |
EMPLOYMENT |
INCOME |
EMPLOYMENT |
|
Cape Town |
1.4 |
2.3 |
-3.9 |
-1.3 |
|
Johannesburg |
1.9 |
2.5 |
-3.7 |
-4.8 |
SOURCE: Global Metro Monitor, Brookings Institute and London School of Economics, 2010
CAPE TOWN: PERCENTAGE CHANGE IN GGP
|
2005 |
2006 |
2007 |
2008 |
2009 |
|
5.7 |
5.8 |
6.2 |
4.0 |
-2.2 |
SOURCE: Moody's Investor Services, 2010
APPENDIX 2
THE CAPE TOWN STORY
Basic service delivery indicators over time
FORMAL HOUSING
|
Share of households occupying formal dwellings (%) |
|||
|
|
Cape Town |
eThekwini |
Johannesburg |
|
2002 |
79.2 |
72.6 |
74.2 |
|
2005/06 |
78.0 |
71.0 |
72.6 |
|
2009 |
80.4 |
72.7 |
77.6 |
SOURCE IHS Global Insight 2010
SANITATION
|
Share of households with Hygienic toilets (%) |
|||
|
|
Cape Town |
eThekwini |
Johannesburg |
|
2002 |
88.5 |
73.9 |
89.5 |
|
2005/06 |
91.6 |
75.6 |
90.9 |
|
2009 |
94.6 |
79.8 |
91.4 |
SOURCE: IHS Global Insight 2010
WATER INFRASTRUCTURE
|
Share of households with piped water at or above RDP level (%) |
|||
|
|
Cape Town |
eThekwini |
Johannesburg |
|
2002 |
93.1 |
87.0 |
94.2 |
|
2005/06 |
93.5 |
82.5 |
93.1 |
|
2009 |
96.5 |
84.2 |
93.3 |
SOURCE: IHS Global Insight 2009
ELECTRICITY CONNECTIONS
|
Share of households with electricity connections |
|||
|
|
Cape Town |
eThekwini |
Johannesburg |
|
2002 |
89.8 |
83.1 |
88.8 |
|
2005/06 |
91.3 |
85.3 |
91.1 |
|
2009 |
96.5 |
89.6 |
88.8 |
SOURCE: IHS Global Insight 2009
HOUSING DELIVERY
|
|
2003/4 |
2004/5 |
2005/6 |
2006/7 |
2007/8 |
2008/9 |
2009/10 |
|
Houses |
1808 |
3469 |
4585 |
7519 |
6439 |
9576 |
8950 |
|
Expenditure |
189m |
299m |
317m |
355m |
450m |
663m |
660m |
SOURCE: City of Cape Town Annual Reports & Housing Directorate, Executive Director Hans Smit
APPENDIX 3
CAPE TOWN STORY
Through the Eyes of Others
How Cape Town has been rated recently by reputable and knowledgeable outsiders
|
WHO |
WHEN |
WHAT THEY SAID |
|
Support programme for Accelerated Infrastructure Development (SPAID) |
2009 |
Cape Town scored 91% for universal access and 87% for higher access to services. Cape Town was the highest ranked institution of any sort in a study that included all provincial, metropolitan and district councils in SA. |
|
HIS Global Insight |
2009 |
Cape Town ranked top of all SA metropolitan governments in terms of water, sanitation, refused collection and electricity infrastructure. |
|
Municipal IQ |
2007-09 |
Municipal Productivity index ranked Cape Town first in 2007, third in 2008 and second in 2009. |
|
Moody's Investor Service |
2010 |
The City of Cape Town is "rated at the high end of the five metropolitan municipalities rated by Moody's in South Africa". |
|
Empowerdex |
2010 |
Service Delivery Index found that "Cape Town is clearly the best city in the country for service delivery" |
|
National Treasury |
2010 |
Section 71 Report praised the City's ‘robust financial systems' and job-creation track, putting it well ahead of other metros in South Africa. It mentioned Cape Town's sixth successive unqualified audit, welcomed the "good planning and adequate capacity to spend by the City", and praised Cape Town for collecting the highest proportion of its budgeted revenue of any Metropolitan government in South Africa (96.4%). |
|
Global Credit Rating
|
2010 |
City of Cape Town "maintained its AA- rating from the previous year because of its good cash flows, its continuous debt collection drive and its tight management over expenditure". While other metros are struggling to meet debts to Eskom and the Rand Water Board, the City of Cape Town is fully paid up due to its prudent financial planning". |
NOTES TO COMMENTS:
Support Programme for Accelerated Infrastructure Development (SPAID)
Cape Town was ranked first among South African local authorities, including all Metro governments, in a 2009 study conducted by the Support Programme for Accelerated Infrastructure Development (SPAID). SPAID has developed a Universal Household Access to Basic Services (UHABS) Index. This is a major project co-funded by the Presidency and the Business Trust. It has to be taken extremely seriously as it is part of a wider programme, The Municipal Data Improvement Programme, organized by the Department of Cooperative Government and Traditional Affairs (CoGTA) to bring methodological consistency to development data in South Africa.
CoGTA states: "The key objective (of) the UHABS index is to be an indicator for independently measuring and communicating the extent and nature of basic service backlogs in communities and demonstrating progress in addressing (them)." It is based purely on "official data agreed and release by Stats SA".
The study found that of the 24% of Cape Town households that live below the poverty line, an effective 100% (i.e. over 99.5%, rounded to the nearest whole number) had basic access to water and 91% "higher access"[82]. In sanitation, 94% had basic access and 93% "higher access"[83]. In refuse collection the figures were 98% basic and 94% higher; in electricity both figures are 95%.
The City of Cape Town scored 91% for universal access and 87% for higher access. In other words the study found that 91% of Cape Town's population enjoyed access to at least RDP basic standards in all four services (water, sanitation, electricity and refuse removal). 87 percent enjoyed "higher access" to all 4. Cape Town was the highest ranked institution of any sort in a study that included all provincial government, all metropolitan governments and all district councils.
IHS Global Insight 2009
Global Insight's study is probably the best South African study in grappling with inconsistencies across different available data sets; as a result the top ranking accorded to Cape Town in this study may be the most significant of all assessments around service delivery.
There are considerable discrepancies between the numbers produced by Stats SA (and in fact between that organisations own products), the Metros themselves (which often appear to be measuring completely different things) and departments of national government (CoGTA, Water Affairs, Housing, Safety and Security). Time periods vary, definitions differ, and key basic comparatives (like the number of households) have been changes dramatically.
Global Insight's report, accounts for four elements of household assess to infrastructure: water, sanitation, refused collection and electricity. The company has created an index that measures the population-adjusted, service weighted access to infrastructure. For each infrastructure category, a sub-index was created by weighting the different levels of service. For example, the sanitation sub-index counts 1 for each household that has a flush toilet, but only 0.1 for each household on the bucket system. Throughout the sub-indices, households without any infrastructure receive a zero weighting. By summing the households in this manner and dividing by the total number of households in the region, we derive a total percentage of ‘serviced' households for each of refuse, sanitation, water and electricity.
Municipal IQ 2007-09
Municipal IQ launched the companies Municipal Productivity Index in 2007. It measures 5 factors:
- The extent of poverty in a Metro and Metro government's response
- Access to a minimum level of Metro services;
- Economic activity and economic infrastructure;
- Metro financial governance (revealed through expenditure patterns);
- Occupancy rates in the Metro administration.
These measurements set out to establish how productive the average resident of any SA municipality can be.
In 2007, Municipal IQ ranked Cape Town top of SA's 6 Metros. The city did "significantly better" in its "response to poverty, through the provision of free basic services".
In 2008, Municipal IQ ranked Cape Town 3rd with Johannesburg top and Tshwane 2nd. The reason given for Cape Town's fall was "poor relative performance on financial governance and expenditure". Johannesburg's rise was determined by "consistently good performance" against the same indicator.
In 2009 Johannesburg remained top ranked with Cape Town returning to 2nd.
Like all composite indices this one has it's limitations. In this case it seems it seems that a high weighting is accorded to spending [presumably "per person"] (in the ‘financial governance and expenditure category), without regard to its quality and insufficient attention to prudent financial management. As a result, while Financial IQ likes Johannesburg's financial management, other, perhaps more relevant assessments beg to differ.
In December 2008, Rating agency Moody's observed that: "Johannesburg's Aa2.za rating could come under pressure if market conditions or weakened fiscal discipline result in higher debt levels and lower tax collection that adversely impact its financial profile". That is precisely what happened.
In February 2010, ratings agency Moody's downgraded Johannesburg's credit rating (Business Day 5/2/2010) following a downgrade by Fitch in 2009. The same report says that in National Treasury's 2009 MTREF remarked that Johannesburg's "spending on repairs and maintenance was sorely lacking" at 1,8% of adopted budget (vrs. average for Metros of 5%)
Moody's Investor Service
Ratings agency Moody's found, in 2010, that: Cape Town's rating reflects its sound financial management. The city adheres to prudent policy strategies with respect to financial, debt and liquidity management. The incumbent administration will remain in charge until 2011. A well established and focused management team provides some stability to the city's strategic planning and operations. Budget execution and cash flows are regularly monitored and the administration is committed to reinforce internal controls.
Moody's found that: "Cape Town has been able to navigate the liquidity pressure associated with the decline in revenue collections given the difficult economic environment and to maintain comfortable liquidity reserves... with only a moderate increase in debt exposure. ... As a reflection of its prudent cash flow management, the city has not resorted to short-term credit lines from local banks".
And: "the significant decrease in capital transfers from the national government after 2010 is not expected to harm the city's financial position, due to its commitment to manage the implementation of large investments within the limits posed by budgetary resources and a manageable increase in financial leverage".
Moody's concluded that: "The City of Cape Town is rated at the high end of the five metropolitan municipalities rated by Moody's in South Africa".
Empowerdex
Empowerdex is South Africa's biggest and best-know/ BEE Ratings Agency. However the company also does other kinds of investment rating. In October 2009 it produced a Service Delivery Index which it justified by pointing out that its bread and butter work, BEE certification (mostly) for the private sector is a narrow indicator which does not give any sort of reading of the impact of BEE on society generally. With there being a popular (and accurate) perception that "BEE has not reached all levels of our society", the Service Delivery Index was designed to provide insight into precisely that issue.
The Index found that "Cape Town is clearly the best city in the country for service delivery". The Index, which considers housing, water, sanitation, electricity and waste removal, combines figures for the current status of household access to services with an improvement index over 6 years. The overall score is calculated to minimize the effects of urbanization on the score. The Index compares data from the 2001 Census with the 2007 Community Survey.
EMPOWERDEX: Metropolitan Municipalities
Overall Final Score (weighted for increase/decrease in number of households)
|
1 |
Cape Town |
73.40 |
|
2 |
Johannesburg |
70.80 |
|
3 |
Nelson Mandela |
69.10 |
|
4 |
Tshwane |
66.80 |
|
5 |
Ekhuraleni |
66.40 |
|
6 |
eThekwini |
62.16 |
SOURCE: Empowerdex Service Delivery Index (Citydex) p. 21
National Treasury Section 71 Report 2010
The National Treasury's 31 August 2010 report on local government budgets ("Local Government Budgets 2009/10 Financial Year", generally referred to as the Department's annual "Section 71 Report" (because it is required by Section 71 of the Municipal Finance Management Act of 2003) singled out Cape Town's budget management for particular praise.
The Report praised the City's ‘robust financial systems' and job-creation track record (10 000 new permanent jobs and 16 300 temporary jobs), putting it well ahead of other metros in South Africa. It mentioned Cape Town's sixth successive unqualified audit, welcomed the "good planning and adequate capacity to spend by the City", and noted the creation of 10,000 permanent jobs (and 16 300 temporary jobs) in Cape Town, in spite of the economic recession.
The Report also praised Cape Town for collecting the highest proportion of its budgeted revenue of any Metropolitan government in South Africa (96.4%).
Global Credit Rating
12 April 2010 Global Credit Rating (GCR), an international credit rating agency, awarded the City of Cape Town administration one of the highest possible long term debt ratings: AA-. This was the co-highest rating achieved by any of the municipalities reviewed by GCR, putting Cape Town well ahead of Johannesburg, Tshwane, Nelson Mandela Bay and Buffalo City, all of which are ANC-run.
According to GCR's ratings system, an AA- rating means that the City of Cape Town boasts a "very high credit rating" and that its "protection factors are very strong." It compares favourably, for instance, with the A scored by the City of Johannesburg (which means that "risk factors are variable and greater in periods of economic stress") and the BBB+ scored by the City of Tshwane, where there is deemed to be "considerable variability in risk during economic cycles". BBB, in fact, basically amounts to junk bond status.
The City of Cape Town "maintained its AA- rating from the previous year because of its good cash flows, its continuous debt collection drive and its tight management over expenditure". While other metros are struggling to meet debts to Eskom and the Rand Water Board, the City of Cape Town is fully paid up due to its prudent financial planning.
Issued by the Democratic Alliance, March 28 2011. Source: http://thedadeliverydaily.com/
Click here to sign up to receive our free daily headline email newsletter
FOOTNOTES:
[1] In 2008 Cape Town experienced a smaller economic contraction than the national economy (1,8% vrs 4%); job losses data suggests only a 0,5% contraction, mainly attributable to an increase in the rate of labour force participation. SOURCE: City of Cape Town (2010) Five year Plan for Cape Town: Integrated Development Plan (IDP) 2007-2012. p.25
[2] "Sewerage crisis looms over central Cape Town", Cape Argus, 29 September 2005
[3] "City's sewage effluent often fails national standards", Cape Times, June 22 2006
[4] Nicol, M. Gubeni, Z. and Makgamathe, L. (2006) "Overflow and Outages: Mismanagement of Utilities in Two Cities" (in) Brown, S. (ed) Economic Transformation Audit: Money and Morality (Cape Town: The institute for Justice and Reconciliation)
[5] CMA Interim Metropolitan Development Framework: The way forward: Draft Report" 14 December 2003 (in) Nicol et al (2006) p. 6.
[6] Nicol et al p. 9
[7] City of Cape Town, Integrated Development Plan (IDP) 2007/08 - 2011/12, 2008/09 Review
[8] Interview: Ald. Clive Justus
[9] The Law Commission (2008) "Administrative Redress: Public Bodies and the Citizen" Consultative Paper No 187, United Kingdom
[10] South African Cities Network (2006) State of the Cities Report
[11] South African Cities Network (2006) State of the Cities Report
[12]Helen Zille (2006) Address to the Cape Chamber, July
[13] City of Cape Town Annual Report 2006/07
[14] Helen Zille Budget Speech 2007/08
[15] 2010 figures. From: City of Cape Town (2010) Five Year Integrated Housing Plan 2010/11 - 2014/15 pps. 11 and 17
[16] Interview Ald. JP Smith
[17] Interview: Ald. JP Smith
[18] Helen Zille, Budget Speech 2006/07
[19] Helen Zille, Budget Speech 2007/07
[20] The First 100 days in Cape Town, June 2006
[21] Ald. Dan Plato (in) City of Cape Town (2010) Five year Plan for Cape Town: Integrated Development Plan (IDP) 2007-2012 p.2
[22] Helen Zille (2007) Budget Speech 2007/08, 30 May
[23] City of Cape Town Annual Report 2006/07
[24] Interview Ald Belinda Walker
[25] Helen Zille, Budget Speech 2007/08
[26] Interviews Ald Belinda Walker, Ald. Felicity Purchase
[27] Economic development and job creation; meeting integrated access and mobility; building integrated human settlements; building strong communities; equitable and effective service delivery; creating an enabling institutional framework. See City of Cape Town Annual Report 2006/07 p.6
[28] City of Cape Town Annual Report 2006/07
[29] City of Cape Town Annual Report 2006/07
[30] Achmet Ebrahim (in) City of Cape Town Annual Report 2008/09
[31] Helen Zille, Budget Speech 2007/08
[32] Moody's Investor Service (2010) Report on the City of Cape Town
[33] Moody's Investor Service (2010) Report on the City of Cape Town
[34] Helen Zille Budget Speech, 2008
[35] City of Cape Town Annual Report 2010
[36] Interview: Ian Nielsen-
[37] Interview: Ian Nielsen
[38] Helen Zille Budget Speech 2008/09
[39] Helen Zille Budget Speech 2007/08
[40] Helen Zille Speech to the Cape Chamber, 2006
[41] Helen Zille speech to the Cape Chamber, 2006
[42] Ian Nielsen, Open Opportunity Society for All: Procurement, presentation, 2010
[43] Interview: Ian Nielsen
[44] SAP is the standard big organisation data processing system. Originally the acronym of its German name, SAP is now regarded as standing for Systems, Applications and Products in Data Processing
[45] Interview: Belinda Walker
[46] City of Cape Town Annual Report 2009/10 p.60
[47] Helen Zille Budget Speech 2008/09
[48] Helen Zille Budget Speech 2006/07
[49] Helen Zille Speech at the Khayelitsha Development Forum, May 2008
[50] Zille, Helen (2009) The ANC is pro-poverty, not pro-poor", SA Today
[51] City of Cape Town Budget 2010/11 - 2012/13
[52] Interview: Clive Justus
[53] The Social Housing Foundation (2010) Social Housing Trends, March, p.1
[54] City of Cape Town (2010) Five year Plan for Cape Town: Integrated Development Plan (IDP) 2007-2012 p. 26
[55] City of Cape Town Annual Report 2006/07
[56] Empowerdex (2009) Service Delivery Index
[57] The RDP minimum is access to a standpipe within 200m of the household
[58] Basic means at least a flush toilet with a septic tank or a pit latrine with a ventilator
[59] City of Cape Town Annual Report 2010
[60] Support Programme for Accelerated Infrastructure Development (2009) Universal Household Access to Basic Services (UHABS)
[61] City of Cape Town (2007) Water Services Development Plan p.7
[62] City of Cape Town (2009) Community Satisfaction Survey
[63] City of Cape Town (2010) Five year Plan for Cape Town: Integrated Development Plan (IDP) 2007-2012 p 27
[64] The Urban Renewal Programme is a national programme initiated in 2001.
[65] Palitza, Kristen (2010) Urban Renewal Reduces Crime in South African Township, IPS
[66] Slamdien, Fadela (2010) From Rape Capital to Safe Capital
[67] Helen Zille (2008) Speech at the Khayelitsha Development Forum meeting, Sizimisele Secondary School, 11 May
[68] Interview: Ald. Sims
[69] City of Cape Town
[70] See CSIR (2007) The State of Municipal Infrastructure in South Africa and its Operation and Maintenance: An Overview p. 6
[71] Helen Zille Bela Bela speech
[72] In 2009/10, Cape Town had 43 dedicated traffic enforcement officers, Johannesburg had 240. Cape Town raised R13m in traffic fines, Johannesburg R60m SOURCE: Ald JP Smith e-mail correspondence
[73] Cape Town annual Report 2009/10 p. 44
[74] City of Cape Town Annual Report 2009/10
[75] James Vos, Chair Health Portfolio Committee, speech 4 Jan 2011
[76] Interview: Cllr James Vos
[77] Interview: Ian Nielsen
[78] Interview: JP Smith
[79] Interview: Clive Justus
[80] 2009/10 Annual Report, p.26
[81] City of Cape Town Annual Report 2009/10 p. 46
[82] i.e. Higher than the RDP minimum of a standpipe within 200m
[83] Basic means at least a flush toilet with a septic tank or a pit latrine with a ventilator
