
Adcorp Employment Index, January 2011, Thursday, February 10 2011
Salient features
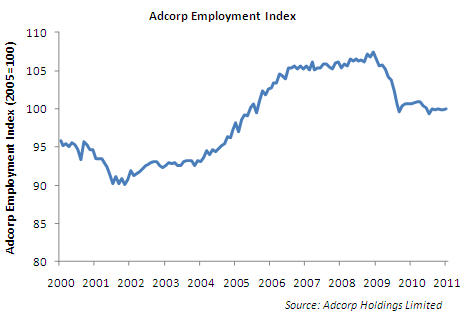
- The Adcorp Employment Index rose slightly by an annualized 0.9% in January. All employment types reported increases, but the biggest increases were in temporary employment (2.5%) and agency employment (4.8%).
- Employment remains patchy and weak. All sectors reported declines in employment except for government, where employed rose by 8.8% on an annualized basis.
- Significant job losses occurred in the construction sector, where employment fell by 6.6%, and moderate job losses occurred in the financial services and wholesale and retail trade sectors, where employment fell by 3.7% and 3.6% respectively.
- Employment of high-skilled workers (notably managers and professionals) increased by 5.9%, reflecting the economy's continued strong need for skills.
- In this month's analysis, Adcorp concludes that the proposed labour law amendments will result in 1,056,912 job losses, and quite probably more when the full effects of declining labour intensity are considered.
- From January 2011 onwards, the Adcorp Employment Index includes the unofficial sector. The unofficial sector, which is not recognized by Statistics SA, numbers 6.19 million people according to Adcorp's estimates. It includes unrecorded and, in some cases, illegal transactions such as employment of unregistered foreigners, evasion of income, payroll and other taxes, and other economic activity in the underground economy. Adcorp will continue to report on unofficial sector employment on a monthly basis.
- From January 2011 onwards, the Adcorp Employment Index will no longer include employment by province, due to difficulties associated with collecting the underlying data in a timeous and reliable fashion.
Analysis
The labour law amendments proposed by the Minister of Labour in December 2010 will have three primary consequences.
Firstly, they will reduce the demand for labour in the formal sector. Medium- and large-sized enterprises will experience increases in operating costs and retrenchments will rise.
Secondly, they will increase the supply of labour in the formal sector. Large numbers of workers will ditch informal employment and seek formal employment on highly advantageous conditions in or near urban areas. Their skills will not meet employers' expectations of high productivity to match higher formal sector wages, and they will join a fruitless quest for formal employment.
Thirdly, they will give rise to an increase in informal employment, particularly on the urban periphery and in rural areas. For these reasons, unemployment in the formal sector is likely to rise significantly: the pool of job-seeking labour will rise in the formal sector, the number of available formal sector jobs will shrink, and the influx of workers into the informal sector will depress wages there.
Ironically, the proposed labour law amendments will represent the most significant "informalization" of the economy since the Labour Relations Act (1995). The amendments, their key provisions and impacts are shown in the table.
Labour Law Amendments: 2010-2011
|
Bill |
Key provisions |
Key impacts |
|
Labour Relations Act (1995)* |
* Repeal s198, replace with Employment Services Bill * Indefinite employment required |
* Employment agencies restricted to recruitment function only * Permanency presumed |
|
Basic Conditions of Employment Act (1997)* |
* Equal pay for work of equal value * Repeal s82, replace with Employment Services Bill * Criminal penalties for overtime |
* Employment agencies restricted to recruitment function only * Wage differentiation prohibited * Overtime severely restricted |
|
Employment Equity Act (1998)* |
* Fines and/or criminal penalties |
* Severe sanctions for non-compliance |
|
Immigration Act (2002)* |
* Eliminate quota work permits * Prohibit immigration practitioners |
* Restricted foreign access |
|
Employment Services Bill |
* Creation of government employment agencies * Agencies only permitted to recruit * Licences required |
* Compulsory employer registration of vacancies with government employment agencies
|
Note: * Amendment bill.
It is interesting to present a scenario to determine the likely number of workers and/or jobs affected. While a scenario is necessarily an estimate, with varying degrees of probability, it is useful to gain a sense of the magnitudes involved. The scenario is presented below:
1. Permanency: Based on CAPES data for the industry, 22% of temp assignments last 24 months or longer. It is likely that 80% of these (or 686,400) will be converted into permanent positions, with attendant medical aid, pension fund and administrative burdens on the employer. Moreover, with anything between 13.1% (mining) and 59.2% (construction) of their workforces employed on a temporary basis, these industries will suffer the following payroll burdens from the migration of permanent to temporary staff:
|
Sector |
Proportion of temporary workers (%) |
Payroll burden of permanency (R billions) |
|
Mining and quarrying |
13.1 |
8.79 |
|
Electricity, gas and water supply |
23.5 |
15.76 |
|
Community, social and personal services |
23.5 |
15.76 |
|
Manufacturing |
30.0 |
20.12 |
|
Finance, insurance, real estate |
31.1 |
20.86 |
|
Transport, storage and communication |
39.7 |
26.63 |
|
Wholesale and retail trade |
42.8 |
28.71 |
|
Construction |
59.2 |
39.71 |
|
TOTAL |
- |
176.34 |
2. Equal pay: With 3.78 million temps around South Africa, average temp remuneration around R68,000 per annum, and with the average pay discrepancy between temps and perm employees around 11%, this is expected to increase employers' payrolls by R36.12 billion per annum.
3. Equal benefits: With 3.78 million temps around South Africa, and with two dependents per temp on average, and employer contributions to entry-level medical aid at R150 per member per month, this is expected to increase employers' payrolls by R27.19 billion per annum. With employer contributions to entry-level retirement funds at R120 per member per month, this will increase payrolls by R21.63 billion per annum.
4. Imported skills: With high-skilled locals representing 18.7% of the total workforce, and with additional immigration controls likely to raise high-skilled locals' wages by 9.6% per annum above the market-related level, the payroll burden to employers will be R91.95 billion per annum.
5. Fines: With medium- and large-scale employers, to whom employment equity-related fines will be most applicable, representing 37.2% of total employment, the annual burden of fines, turnover taxes, etc. is likely to be R9.36 billion.
6. Prohibition of agencies: With 0.98 million temp assignees and a R26 billion industry, temporary staffing companies will be reduced to recruitment-only functions, resulting in a decline in business of R21.33 billion.
7. Administration: At an average HR Dept cost of R1,220 per employee per annum, and an additional 30% burden expected from the proposed labour laws, the legal administration cost to employers is likely to be R4.61 billion.
The total Rand value of effects listed above is R212.19 billion. By applying the current average revenue per worker (R200,764), this amounts to 1,056,912 workers whose jobs will be shed as a direct consequence of the proposed labour laws. To the extent that the effects listed above, and some other indirect effects not considered here, reduce the economy's overall labour intensity of production over time, the number of job losses attributable to the proposed labour laws will be significantly higher.
Additional Data
Employment by Type
|
Occupation |
Employment Jan 2011 |
Percentage change vs. Dec 2010* |
|
Unofficial sector** |
6,190,032 |
- |
|
Official sector |
1.34 |
|
|
Typical (permanent, full-time) |
0.87 |
|
|
Atypical (temporary, part-time) |
3,791,232 |
2.46 |
|
- of which agencies |
983,477 |
4.82 |
|
Total |
19,067,576 |
0.90 |
* Annualized ** New series
Employment by Sector
|
Sector |
Employment Jan 2010 (000s) |
Percentage change vs. Dec 2010* |
|
Mining |
311 |
-3.85 |
|
Manufacturing |
1,415 |
-0.85 |
|
Electricity, gas and water supply |
86 |
0.00 |
|
Construction |
541 |
-6.62 |
|
Wholesale and retail trade |
1,636 |
-3.66 |
|
Transport, storage and communication |
523 |
-2.29 |
|
Financial intermediation, insurance, real estate and business services |
1,603 |
-3.73 |
|
Community, social and personal services |
2,598 |
8.84 |
* Annualized
Employment by Occupation
|
Occupation |
Employment Jan 2010 (000s) |
Percentage change vs. Dec 2010* |
|
Legislators, senior officials and managers |
1,021 |
5.91 |
|
Professionals |
664 |
5.45 |
|
Technical and associate professionals |
1,537 |
6.28 |
|
Clerks |
1,457 |
-1.64 |
|
Service workers and shop and market sales workers |
1,802 |
-2.66 |
|
Skilled agricultural and fishery workers |
102 |
-11.65 |
|
Craft and related trades workers |
1,452 |
-0.83 |
|
Plant and machine operators and assemblers |
1,039 |
-2.31 |
|
Elementary occupation |
2,422 |
-3.46 |
|
Domestic workers |
816 |
8.89 |
* Annualized
Employment by Province*
|
Province |
Employment Jan 2010 (000s) |
Percentage change vs. Dec 2010** |
|
Western Cape |
1,716 |
- |
|
Eastern Cape |
1,276 |
- |
|
Northern Cape |
289 |
- |
|
Free State |
738 |
- |
|
KwaZulu-Natal |
2,420 |
- |
|
North West |
805 |
- |
|
Gauteng |
3,623 |
- |
|
Mpumalanga |
855 |
- |
|
Limpopo |
853 |
- |
* Discontinued ** Annualized
Issued by Adcorp, February 10 2011
Click here to sign up to receive our free daily headline email newsletter
