
Adcorp Employment Index, April 2011
Salient features
Employment increased slightly, at an annual rate of 1.86%, during April.
Unlike March, when employment increased across-the-board, employment growth was patchy and uneven during April. Employment grew fastest in the high-skilled occupations (senior management, professionals, and technicians) and continues to decline in the low-skilled occupations (elementary and domestic work).
Continuing a long-term trend that has been in evidence since 1995, the informal sector grew faster than the formal sector during April, largely driven by small-scale employers opting out of income taxes and labour regulations. The informal sector now employs 6.2 million people - 1.5 million (or 31%) more than in 1995.
In this month's analysis, we take a closer look at the shortage of high-skilled workers in South Africa. Using data available to Adcorp (such as recruitment lead times, applicant/job ratios and job fill rates), Adcorp calculates that there are currently 829,800 unfilled positions for high-skilled workers across a wide range of occupations, including senior management, the professions (medicine, engineering, accounting and the law), technical occupations (specialized technicians and artisans), and agriculture.
To a great extent, the shortage of high-skilled workers has been artificially induced by the Immigrations Act (2002), which made it exceedingly difficult for foreigners to find work in South Africa. The most recent amendments to the Immigrations Act, promulgated in April 2011, prohibit the use of immigration agents and quota work permits, both of which have historically been widely used by South African companies seeking foreign skills. As a result, South African citizens' wages in high-skilled occupations have been unduly escalated, in inflation-adjusted terms, by 286.4% since 2000.
Adcorp Employment Index

Source: Adcorp Holdings Limited
Analysis
Most economists agree that South Africa's skills shortage poses a significant limitation on the country's long-term economic growth potential. Due to a lack of needed skills, including managerial, professional and technical skills, viable economic opportunities cannot be productively tapped. Many existing economic activities are, given pervasive skills shortages, conducted inconsistently and, apparently, inexpertly, which is probably a more significant factor in South Africa's low labour productivity by global standards than is widely thought.
Yet considerable uncertainty surrounds the exact quantum of South Africa's skills shortage. Many governmental skills development initiatives - including the National Skills Fund, which is financed by a 1% payroll tax on all but the country's smallest employers - are based on an imprecise idea of the extent of skills shortages, not only in particular occupations, but in the economy as a whole.
Sector Education and Training Authorities (SETAs) have consistently failed to produce credible estimates of skills shortages in their respective sectors, and probably for this reason the National Skills Fund has failed to disburse more than R3.5 billion in funds available for skills development.
Adcorp is in a unique position to add quantitative detail to the skills shortage. As South Africa's largest employment services company, with more than 98,000 employees distributed throughout the South African economy, and with more than 800,000 job applications processed each year, Adcorp is South Africa's pre-eminent authority on the job search process.
Admittedly employment agency statistics are not definitive, since agencies intermediate only 12% of all job searches in South Africa (the vast majority of job placements occurring by "word of mouth"), but as far as hard data are concerned, Adcorp's figures represent the only available estimates of South Africa's skills shortage.
In particular, three pieces of data are noteworthy. The "applicant/job ratio" is revealing about the shortage or surplus of skills in a particular occupation, ranging from 4 applicants per position in highly-skilled and specialized roles (such as gold dealers and credit derivatives traders) to 1,200 applicants per position in generic roles requiring limited prior work experience (such as bank tellers and call centre agents).
Similarly, the "fill rate" for a position (i.e. the percentage of open positions that are filled by suitable candidates) and the "recruitment lead time" (i.e. the average time taken to successfully fill a position) present a picture of the shortage or surplus of available candidates for a particular position.
Defining a skills "shortage" or "surplus" as the surplus or deficit, respectively, of the number of available positions over the number of applicants for those positions - and adjusting for a certain apparent "natural" deficit of positions due to continuous job search activity of an exploratory, informational kind - the following table indicates Adcorp's estimates of the level of skills shortages/surpluses in various occupations in South Africa.
|
Occupation |
Skills |
|
Manager |
216.2 |
|
Professional |
178.4 |
|
Technician |
432.1 |
|
Clerk |
86.6 |
|
Sales and service worker |
104.3 |
|
Skilled agriculture |
3.1 |
|
Craft and related trade |
65.5 |
|
Plant and machine operator |
72.0 |
|
Elementary worker |
-967.6 |
|
Domestic worker |
-247.4 |
|
Total |
-56.8 |
As the above table indicates, there are currently 829,800 unfilled positions for high-skilled workers across a wide range of occupations, including senior management, the professions (medicine, engineering, accounting and the law), technical occupations (specialized technicians and artisans), and agriculture. Average inflation-adjusted remuneration for high-skilled positions is given in the following chart.
As indicated in the chart, South African citizens' wages in high-skilled occupations have escalated, in inflation-adjusted terms, by 286.4% since 2000. It seems extraordinary that such an increase could largely have escaped attention, except that the increase would have been in the interests of skilled South African workers, at the expense of the economy as a whole.
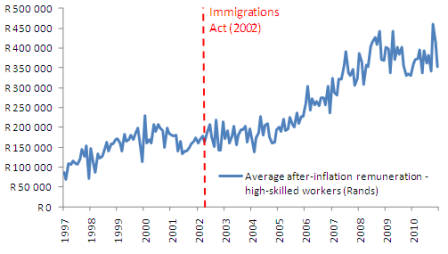
One interesting explanation for the shortage of high-skilled workers in South Africa is the advent of immigration controls, specifically the Immigrations Act of 2002, which made it exceedingly difficult for foreigners to find work locally. The most recent amendments to the Immigrations Act, promulgated in March 2011, prohibit the use of immigration agents and quota work permits, both of which have historically been widely used by South African companies seeking to employ foreign high-skilled workers. The problem is particularly pronounced since immigration practitioners and quota work permits are most commonly used when companies have a recurring need (rather than, say, a once-off or periodic requirement) for high-skilled foreigners.
It seems plausible to speculate that the Immigrations Act was intended to have the effect of improving historically disadvantaged individuals' - i.e. skilled Blacks' - domestic employment prospects, by substantially curtailing foreign job-seekers attempts to compete for jobs in the local labour market. If this interpretation is correct (bearing in mind that it is also possible that the Immigrations Act had no economic rationale whatsoever), the Immigrations Act should be viewed in the same vein as the Employment Equity Act. As such, it should have been subjected by Nedlac to the same scrutiny that applies to all related legislation.
Additional Data
Employment by Type
|
Occupation |
Employment Apr 2011 |
Percentage change vs. Mar 2010* |
|
Unofficial sector |
6,144,287 |
2.33 |
|
Official sector |
12,988,498 |
1.64 |
|
Typical (permanent, full-time) |
9,156,231 |
1.00 |
|
Atypical (temporary, part-time) |
3,832,267 |
3.16 |
|
- of which agencies |
997,237 |
3.63 |
|
Total |
19,132,785 |
1.86 |
* Annualized
Employment by Sector
|
Sector |
Employment Apr 2011 (000s) |
Percentage change vs. Mar 2011* |
|
Mining |
314 |
-7.59 |
|
Manufacturing |
1,420 |
-1.69 |
|
Electricity, gas and water supply |
88 |
-13.48 |
|
Construction |
538 |
-6.65 |
|
Wholesale and retail trade |
1,651 |
2.91 |
|
Transport, storage and communication |
537 |
11.28 |
|
Financial intermediation, insurance, real estate and business services |
1,609 |
3.74 |
|
Community, social and personal services |
2,627 |
3.67 |
* Annualized
Employment by Occupation
|
Occupation |
Employment Apr 2011 (000s) |
Percentage change vs. Mar 2011* |
|
Legislators, senior officials and managers |
1,028 |
8.23 |
|
Professionals |
680 |
8.89 |
|
Technical and associate professionals |
1,563 |
8.51 |
|
Clerks |
1,463 |
-4.09 |
|
Service workers and shop and market sales workers |
1,800 |
-3.99 |
|
Skilled agricultural and fishery workers |
103 |
0.00 |
|
Craft and related trades workers |
1,453 |
-1.65 |
|
Plant and machine operators and assemblers |
1,050 |
3.44 |
|
Elementary occupation |
2,427 |
-3.45 |
|
Domestic workers |
839 |
18.89 |
* Annualized
Issued by Adcorp, May 10 2011
Click here to sign up to receive our free daily headline email newsletter
