
JOHANNESBURG - 551,940 pupils in South Africa wrote the government matric in 2009. 334,716 (60.6%) passed. 109,697 (19.9%) passed with the grades necessary to progress on to university. 275,013 pupils wrote the basic "mathematics literacy" paper. 24.6% of pupils failed it outright, getting less than a 30% score. Only 31.2% of those who wrote the paper passed with more than a 50% score.
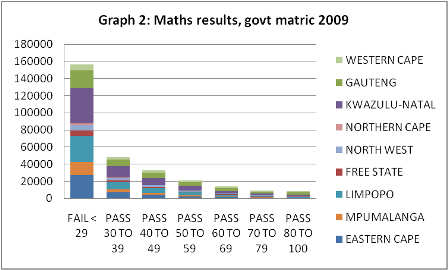
290,407 pupils meanwhile wrote the more challenging "mathematics" paper. 54% received less than a 30% score and failed outright. Another 16,6% received less than 40%. Only 52,779 (18.2%) of those who wrote the paper passed it with more than half marks (or just 9,5% of all those who wrote the governmentt matric.)
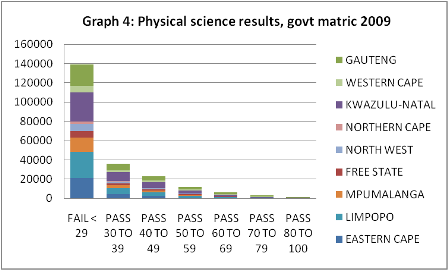
220,882 pupils wrote the "physical science" paper. 139,360 pupils (63.1%) received less than 30% and failed outright. A further 35,904 pupils (16,3%) received less than 40%. Only 10.1% of pupils who wrote the exam received more than 50%.
Tables and graphs follow below:
|
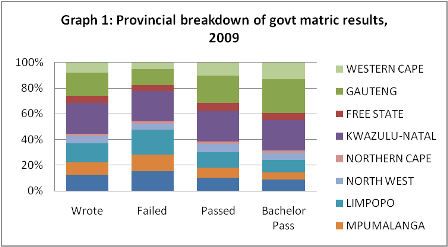
Table 1: The govt matric pass rate by province, 2009 |
|||||||
|
Province |
Wrote |
Failed |
Incomplete |
Pass |
% Pass |
Bachelor pass |
% bachelor |
|
EASTERN CAPE |
68129 |
33071 |
2493 |
34731 |
51.0% |
9492 |
13.9% |
|
FREE STATE |
29808 |
9117 |
654 |
20680 |
69.4% |
6030 |
20.2% |
|
GAUTENG |
98576 |
27655 |
2692 |
70871 |
71.9% |
28709 |
29.1% |
|
KWAZULU-NATAL |
132175 |
50997 |
7789 |
80733 |
61.1% |
26287 |
19.9% |
|
LIMPOPO |
83350 |
42550 |
9939 |
40776 |
48.9% |
10202 |
12.2% |
|
MPUMALANGA |
53975 |
27606 |
1757 |
25852 |
47.9% |
6556 |
12.1% |
|
NORTH WEST |
30664 |
9959 |
731 |
20700 |
67.5% |
6356 |
20.7% |
|
NORTHERN CAPE |
10377 |
4021 |
388 |
6356 |
61.3% |
1741 |
16.8% |
|
WESTERN CAPE |
44886 |
10860 |
1976 |
34017 |
75.8% |
14324 |
31.9% |
|
NATIONAL |
551940 |
215836 |
28419 |
334716 |
60.6% |
109697 |
19.9% |
|
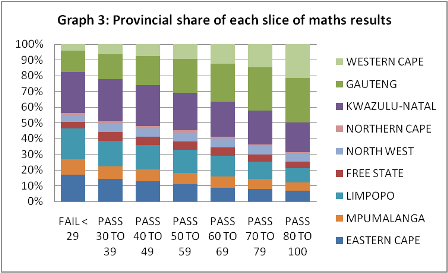
Table 2: Results of mathematics paper, govt matric 2009 |
|||||||
|
PROVINCE |
FAIL < 29 |
PASS 30 TO 39 |
PASS 40 TO 49 |
PASS 50 TO 59 |
PASS 60 TO 69 |
PASS 70 TO 79 |
PASS 80 TO 100 |
|
EASTERN CAPE |
27052 |
6992 |
4273 |
2348 |
1211 |
760 |
614 |
|
FREE STATE |
6196 |
2697 |
1713 |
1126 |
728 |
414 |
384 |
|
GAUTENG |
21066 |
7672 |
6030 |
4477 |
3308 |
2557 |
2455 |
|
KWAZULU-NATAL |
40820 |
12845 |
8509 |
5059 |
3054 |
1986 |
1641 |
|
LIMPOPO |
30625 |
7912 |
5046 |
3121 |
1829 |
1023 |
785 |
|
MPUMALANGA |
15213 |
3707 |
2418 |
1479 |
971 |
583 |
438 |
|
NORTH WEST |
6565 |
2503 |
1731 |
1174 |
771 |
507 |
433 |
|
NORTHERN CAPE |
2266 |
723 |
427 |
258 |
150 |
102 |
94 |
|
WESTERN CAPE |
6737 |
3098 |
2430 |
1994 |
1711 |
1368 |
1866 |
|
TOTAL |
156540 |
48149 |
32577 |
21036 |
13733 |
9300 |
8710 |
|
% |
54.0% |
16.6% |
11.2% |
7.3% |
4.7% |
3.2% |
3.0% |
|
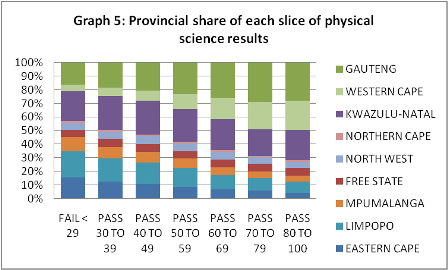
Table 3: Physical science results 2009 government matric |
|||||||
|
FAIL < 29 |
PASS 30 TO 39 |
PASS 40 TO 49 |
PASS 50 TO 59 |
PASS 60 TO 69 |
PASS 70 TO 79 |
PASS 80 TO 100 |
|
|
EASTERN CAPE |
21407 |
4461 |
2492 |
1044 |
410 |
182 |
39 |
|
FREE STATE |
7221 |
2182 |
1386 |
642 |
350 |
174 |
55 |
|
KWAZULU-NATAL |
30616 |
8953 |
5733 |
2896 |
1382 |
615 |
221 |
|
LIMPOPO |
26911 |
6192 |
3680 |
1657 |
660 |
287 |
82 |
|
MPUMALANGA |
14665 |
2880 |
1737 |
823 |
346 |
147 |
46 |
|
NORTH WEST |
7413 |
1979 |
1361 |
706 |
351 |
151 |
45 |
|
NORTHERN CAPE |
2068 |
491 |
266 |
152 |
86 |
28 |
12 |
|
GAUTENG |
22776 |
6596 |
4751 |
2788 |
1598 |
899 |
278 |
|
WESTERN CAPE |
6283 |
2170 |
1784 |
1296 |
976 |
629 |
209 |
|
TOTAL |
139360 |
35904 |
23190 |
12004 |
6159 |
3112 |
987 |
|
% |
63.1% |
16.3% |
10.5% |
5.4% |
2.8% |
1.4% |
0.4% |
Data Source: Department of Basic Education
Click here to sign up to receive our free daily headline email newsletter
