
Can the ANC fall below 50% in the Free State?
4 February 2024
The big picture: In the 2021 local government elections, the ANC dipped into or below the 50% bracket in six provinces. In descending order, they were the North West (56,1%), Free State (51,3%), Northern Cape (51%), KwaZulu-Natal (41,8%), Gauteng (36%) and Western Cape (20,5%).
The graph below sets out the historical electoral numbers for the ANC in these six provinces, using the Provincial and PR ballots.
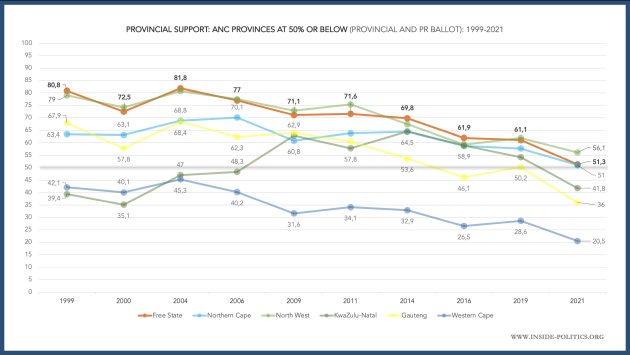
These then, are the six provinces where the ANC’s further decline is most likely, in 2024 – either to drop below 50%, or stay below 50%. Much has been made of Gauteng and KwaZulu-Natal; relatively little of the Free State.
DA leader John Steenhuisen recently said the following: “We believe we can form a coalition government in Gauteng and KwaZulu-Natal and we believe that the political dynamics in the Free State have given us a window of opportunity, although not as solid as KZN and Gauteng to be able to form some kind of government after elections.”
Let us look at the Free State then, see what the numbers say and try to understand what he means. Below is the ANC’s electoral performance in the Free State, in each provincial and local government election since 1994. Some of the bigger opposition parties in the province (The DA, FF+, COPE and the EFF) are included for perspective.
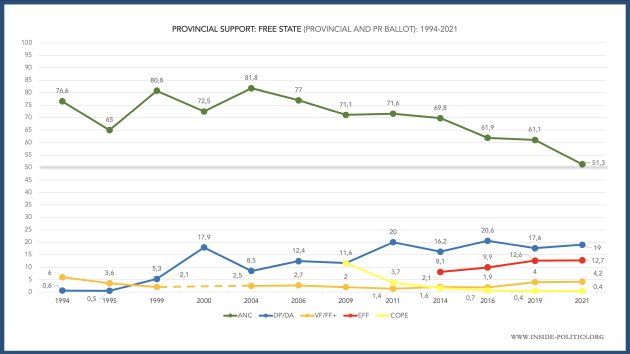
The ANC reached a high point in 2004 (81,8%) but, since then, has declined. It is down 30,5 percentage points in 17 years, to 51,3%. Interestingly, the ANC’s decline is relatively steady. There is no significant fluctuation between local elections (when the ANC does worse) and provincial elections (when it does better).
There was no great growth among the four main opposition parties between the last two elections (2019 and 2021). Between them they grew just 1,7 percentage points, from a collective score of 34,6% up to 36,3%. That is unusual for a local government election, where opposition parties typically capitalise on lower ANC turnout.
However, there was an absolute explosion of new, smaller parties in the Free State; up from just 19 in 2019 to 49 in 2021. Some of them, such as MAP16 – an ANC breakaway with 3,6% in 2021 – managed to register some meaningful support. But it was collectively that they all ate primarily away at the ANC to one small degree or another, fueling its dramatic decline to just above 50% (it dropped 10pts between 2019 and 2021).
Local government elections can be misleading though. Thus, the graph below looks at only provincial elections in the Free State, since 1994.
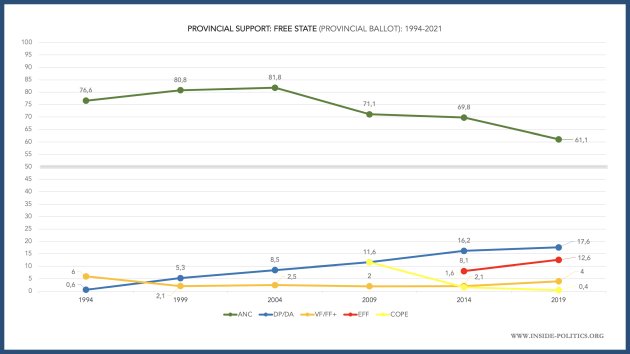
The ANC is still in decline, but ended up on 61,1% in 2019, and so has a buffer ahead of 2024. In turn, the four main opposition parties do better (up 6,6 percentage points collectively since 2014) although nothing dramatic.
There is, however, something distinctive about the ANC’s decline in the Free State, which is hidden by its percentage performance. The table below sets out the ANC’s decline in every province in the last two rounds of local elections (2016 and 2021).
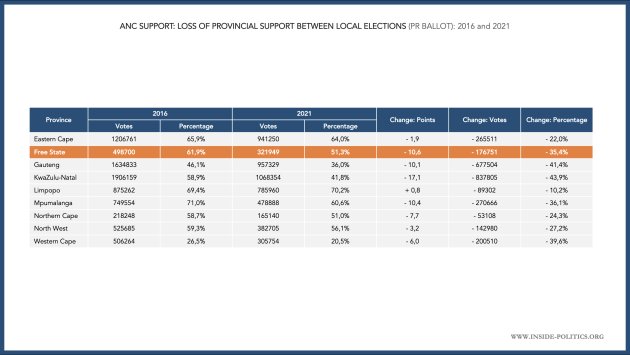
2021 was a catastrophically bad election for the ANC. Its vote imploded everywhere. It lost 10 or more percentage points in 4 provinces (including the Free State). But its decline in absolute numbers is where the real decrease is found. The 677k votes it lost in KZN in 2021, for example, represented 41% of all its 2016 support in that province.
The ANC in the Free State lost 35% of its 2016 support – bad, but not the worst ANC province. However, the graph below shows the same provincial decline between the last two provincial elections – 2014 and 2019. And here, the ANC in the Free State stands alone.
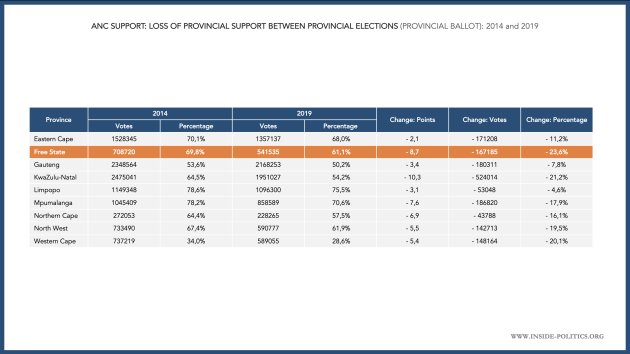
The party lost 23% of its 2014 support in 2019, more than any other province for the ANC. And it is that Provincial Ballot decline – greater than Gauteng or KwaZulu-Natal – that will be of real interest to the opposition, given 2024 is also a provincial election.
So, the question of whether the ANC can be brought below 50% in the province in 2024 is really whether the ANC can lose 12 percentage points. In turn, whether the ANC’s 2019 and 2021 decline will be replicated or increase. If it does, 50% might be on the cards.
Let’s examine the ANC’s last two provincial performances (2014 and 2019) in the Free State in more detail. The Free State is relatively small. It only has 19 municipalities; so, with a bit of effort, we can map the ANC’s support in much more detail than other provinces, right down to municipal level.
The graph below sets out five core indicators – total registered voters, ANC votes, ANC percentage, turnout and the ANC’s vote share as a Percentage of all Registered Voters (or PRV) in the Free State, for every municipality for 2014 and 2019.
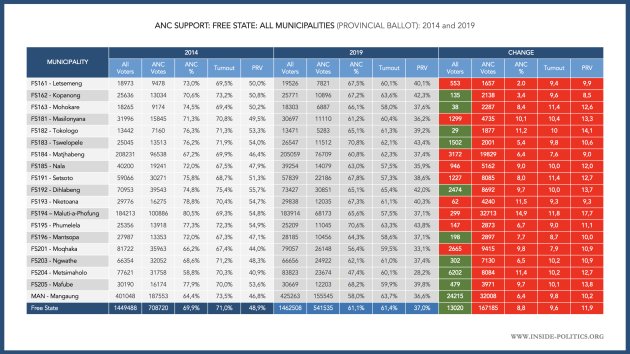
There is a great deal to say about this table. The key points are:
1. Registration in the Free State is dismal, and an indictment of the IEC. We will have to see what the last registration weekend (3 and 4 February) does to the total votes, but given the IEC’s historical performance in the province, don’t expect too much.
2. Linked to this lack of enthusiasm is low turnout. It dropped 10pts in 2019.
3. In turn, the ANC’s PRV dropped (this is a measure of the ANC’s real legitimacy, among all voters), down 12pts, to sit in the 30% bracket.
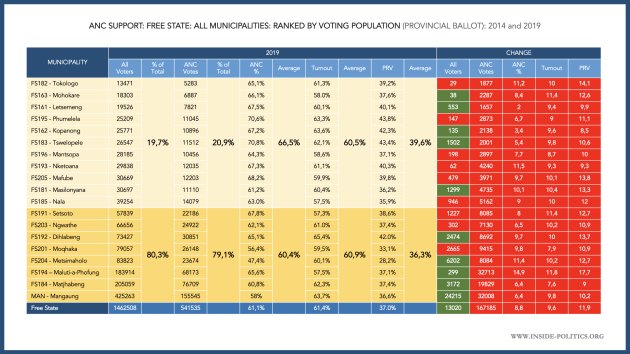
That table is insightful, but only helpful up to a point for our purposes. What we really need is a meaningful way to map those municipalities. There are lots of ways to do this (by vote, percentage, PRV) but one of the most helpful is by total registered voters. There are strong correlations between how populous a municipality is (in other words if it is urban or rural) and ANC support.
The table below ranks all municipalities by total registered voting population, from the least at the top, to the most at the bottom. The dark yellow are the eight most populous Free State municipalities (which account for 80,3% of all Free State voters and 79% of all ANC voters). The light yellow are the least populous. You can see ANC support is higher (average of 66,5%) in less populous municipalities and lower (average of 60,4%) in more populous municipalities.
If we transpose those colours onto a Free State map, we get the graphic below.
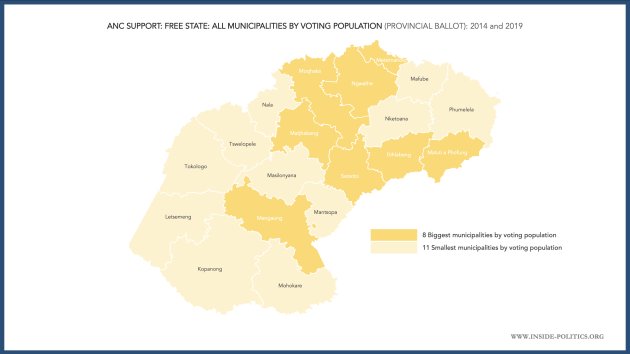
Mangaung – the Free State’s only metro – is surrounded by less populous more rural municipalities. Towards the center and stretching up towards the North West and Gauteng, is where the majority of more populous or urban municipalities are, in general terms. But we can get more sophisticated than this.
The table below divides the total number of registered voters per municipality into four categories, based on their population voting size.
Group 1 (top, dark green): 1 to 30,000 voters (8 municipalities)
Group 2: 30,000 to 60,000 voters (4 municipalities)
Group 3: 60,000 to 100,000 voters (4 municipalities)
Group 4 (bottom, orange): 100,000+ voters (3 municipalities)
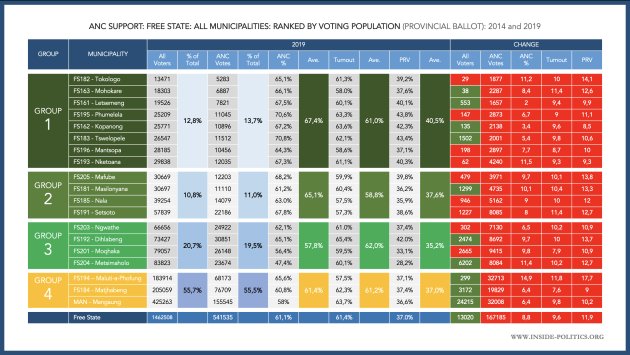 Among the municipalities with less than 100,000 voters (groups 1-3) the ANC’s vote increases the lower the voting population – from an average of 57,8% in group 3 to an average of 67,4% in group 1. This would seem to confirm that our use of population density is a good proxy for other indicators. Group 4 needs to be viewed a little differently, the ANC does relatively worse here (certainly compared to groups 1 and 2) but this group is where the biggest opposition parties are strongest, and thus the forces at play are a little different.
Let us transpose these groups onto our Free State map and see how they look.
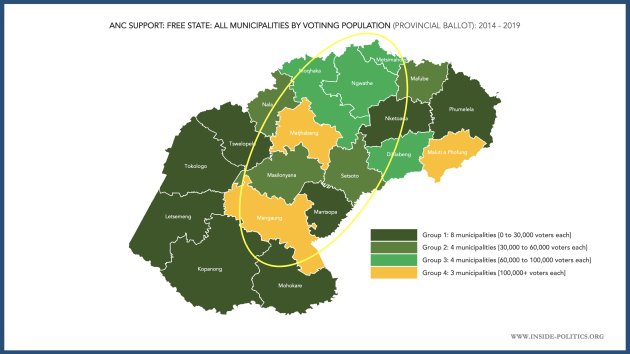
Again, you can see for the most part, the ANC is weakest through central Free State, and strongest towards the Southern fringes.
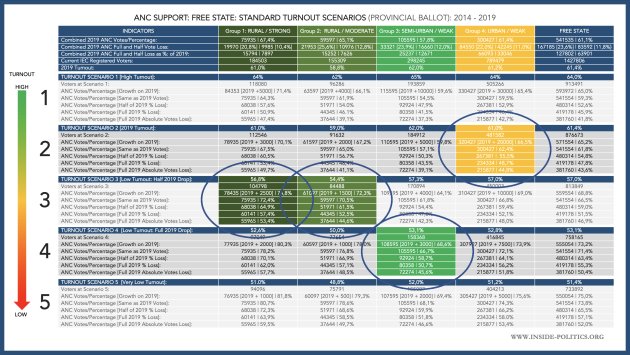
Having established a helpful proxy for other indicators, we can now generate some turnout scenarios, per group, as per the table below, and using the current number of registered voters per Free State municipality according to the IEC (and as of 2 February). This allows us to tailor our modelling per group, using that group’s average ANC votes and turnout.
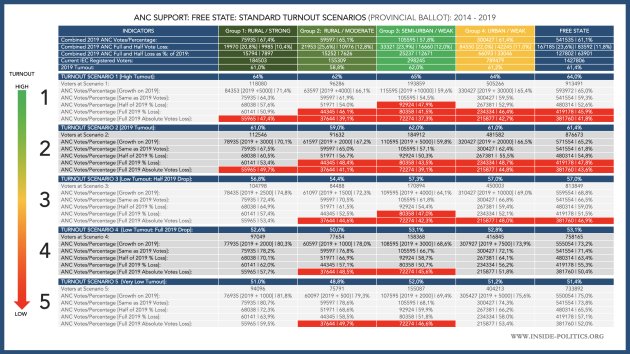 There are five turnout possibilities in terms of percent (high, the 2019 turnout level, low/half 2019 drop in turnout, low/full 2019 drop in turnout and very low – the last one being 10pts lower for every group). As far as projected ANC votes go, there are again five possibilities (ANC growth, same as 2019, half 2019 percentage loss, full 2019 percentage loss and same 2019 absolute number of votes loss.) And all of these tailored to each group.
The version below shows you all the indicators.
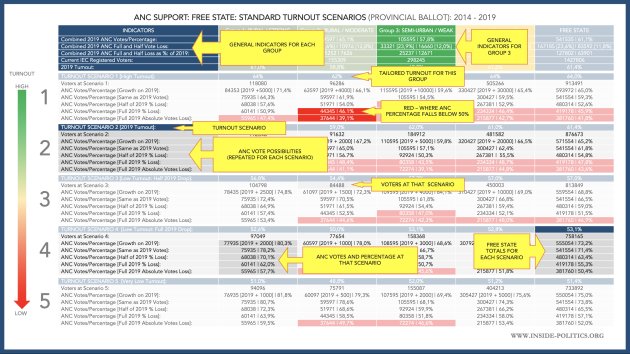
This is a lot of information. A simpler way of phrasing it: These turnout scenarios demonstrate what will happen to the ANC’s vote in 2024, in each group, if turnout improves or drops dramatically, and if the ANC’s vote loss improves or declines, using its 2019 performance as the basis for those declines.
The red boxes indicate scenarios where the ANC vote falls below 50%. As you can see, they dominate the higher turnout scenarios (1 and 2). But it does need to lose a lot of votes for this to happen. The red squares also tend to dominate the bottom two lines of each scenario – where the ANC loses as many votes as it did in 2019 in percentage or absolute terms.
In short: If turnout is higher or the same as 2019, it is quite possible for the ANC to drop below 50% in the Free State. But if turnout is lower, it becomes harder and harder for the opposition to bring the ANC below 50%. Those higher turnout scenarios must also be driven by opposition voters – in more urban municipalities – not the ANC.
What is the point of all these tailored groups though, if we could just use the provincial totals to produce these scenarios? Well, we can get very sophisticated from here.
Given that the groups are a proxy for ANC support, and we know Group 1 is the strongest, and Group 4 the weakest, this can allow us to make some informed assumptions about how likely turnout is to fall per group. Below are four such assumptions (highlighted for each group). This is just to demonstrate what is possible, please don’t consider these assumptions as definitive. They are as follows:
Group 1 (Rural/Strong): Assumption: Given ANC support highest here, turnout it is likely to drop at a lower rate. Thus, Scenario 3 – half of the 2019 turnout drop for this group – or 56,8%
Group 2 (Rural/moderate): Assumption: The ANC slightly weaker here, turnout also likely to drop at a lower rate. Thus, also Scenario 3 – half of the 2019 turnout drop for this group – or 54,4%
Group 3 (Semi urban/weak): Assumption: The ANC performs worst among this group, turnout likely to drop significantly. Thus, Scenario 4 – full 2019 turnout drop for this group – or 53,1%
Group 4 (urban/weak): Assumption: The opposition likely to perform best in urban environments, and make up for ANC voters staying away, so turnout will stay at 2019 levels. Thus Scenario 2 – 2019 turnout for this group – or 61%.
These are all assumptions in the bounds of possibility. Now that we have our four tailored turnout assumptions for each group, we can line our selections up and see what the Free State totals are, as per the graph below.
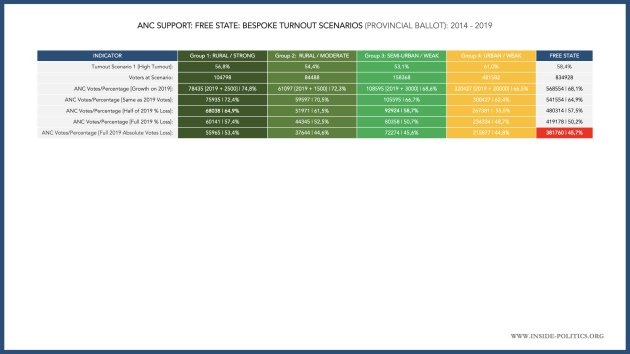
At this tailored scenario, which works out at 58,4% turnout across the province, there is only one ANC vote possibility where it gets below 50% provincially: if it loses the same number of votes, in absolute terms, per group, as it did in 2019. So, it is clearly asking a lot to bring the ANC below 50% in generally terms.
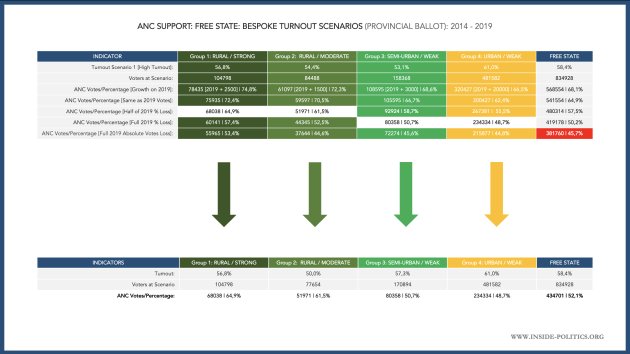
We can, however, refine our scenario even further. Within these selected scenarios per group, we can make a further set of assumptions, as to which ANC vote possibility is most likely. Let’s go with the following:
Group 1 (Rural/Strong): Assumption: Given ANC support highest here, its vote will decline at a slow rate. Thus, Possibility 3 – half of its 2019 loss for this group – so it gets 64,9%.
Group 2 (Rural/moderate): Assumption: The ANC slightly weaker here, its vote is also likely to decline at a lower rate. Thus, also Possibility 3 – half of its 2019 loss for this group – so it gets 61,5%.
Group 3 (Semi urban/weak): Assumption: The ANC performs worst among this group, its vote likely to decline significantly. Thus, Possibility 4 – All of its 2019 loss for this group – so it gets 50,7%
Group 4 (urban/weak): Assumption: The ANC it weak in urban environments, and given our turnout assumptions about the opposition, it is consistent to say it drops here significantly too. Thus, also Possibility 4 – All of its 2019 loss for this group – so it gets 44,8%.
Line them all up, as per the graph below, and you get an ANC provincial percentage of 52,1%. All these assumptions presume a good opposition performance in urban municipalities. So, as above, getting the ANC below 50% is going to be very challenging.
Now, one can make many assumptions, about turnout and ANC vote possibilities. As the election approaches, and we have more information – through polling and by-elections – we can plug other assumptions into our model and see what comes out. But, however you structure them, it would seem the following basic insights stand, which also serve as the key takeaways for this essay:
The ANC’s percentage performance in the Free State is collapsing at a dramatic rate, in local and provincial elections. But this is especially true in provincial elections, where the party lost 23% of all its 2014 support in the Free State in 2019 – the most of any province for the ANC.
Despite this, the ANC still ended up on 61% in the Free State in 2019, and so needs to lose at least 12 pts in 2024 to drop below 50%.
The ANC’s decline on the Free State provincial ballot is likely the reason opposition parties sense an opportunity to bring the ANC below 50% in the province.
A comparison of the ANC’s 2014/2019 performance down to municipal level, demonstrates all key indicators are substantially down for the ANC, across the board.
If the ANC’s performance is ranked by the size of the general voting population, it comes clear that the party does better in rural, less populous municipalities, and worse in semi-urban or urban municipalities with far denser populations.
When refined down further, into four groups of municipalities, from the least populous to the most, this pattern is further evidenced.
Thus, the ANC has a problem in the Free State: it is strong in 12 of the 19 Free State “rural” municipalities, but they also have the least voters. 80% of all ANC support comes from the 8 most populous provinces. So, its performance is likely to turn on those more urban municipalities. From an opposition perspective: this is the opportunity. They perform better in urban environments, and it is here in particular they will want to target their campaigning and drive further ANC implosion.
One problem they have is Free State registration is dire. Current IEC figures (admitted before the second and final registration weekend) have a total of 1,427,806 voters registered across the province. That is just a paltry 34,702 more than 2019 (1,462,508) – a total indictment of the five years the IEC has had to register voters since 2019. The opposition need massive disproportional turnout to win the province, and the IEC numbers suggest that is going to be difficult.
If we run turnout scenarios for each of these four groups, assuming turnout and ANC vote loss in proportion to how strong the ANC is in each of them, it still seems incredibly hard to bring the ANC below 50%, but it is possibly if the ANC’s collapse continues or increases.
If turnout is higher or the same as 2019, it is possible for the ANC to drop below 50% in the Free State. But, if turnout is lower, it becomes harder and harder for the opposition to bring the ANC below 50%. Those higher turnout scenarios must also be driven by opposition voters – in more urban municipalities – not the ANC.
In turn, the ANC needs to lose votes at the same percentage rate, or – even better for the opposition – lose as many votes as it did in absolute terms in 2019, to put the 50% threshold on the table. And, again, that vote loss must happen in more urban municipalities, where most Free State voters are.
Thus, Mangaung metro, Maluti-a-Phofung and Matjhabeng – the three biggest provinces in the Free State in terms of voters, comprising group 4 – will be central to the provincial election outcome (together they account for 55,7% of all Free State voters).
But, no less important are Ngwathe, Dihlabeng, Moqhaka and Metsimaholo – 4 municipalities worth 20% of the ANC’s vote share, and with populations between 60,000 and 100,000 each. Here the ANC’s percentage is in the most trouble (an average of 57,8%), the lowest of any group. These semi-urban provinces – a twilight zone between rural and urban – are where any grand collapse would seem most likely to manifest first.
If we refine our scenarios down, using reasonable assumptions about ANC vote loss in its strong rural groups (that it will lose relatively less) and its weak urban groups (that it decline here at 2019 rates), the ANC still comes out above 50%, although only just.
Finally, opposition parties are correct to target the Free State, something dramatic is happening to the ANC’s vote there. But the buffer it enjoys is substantial. However, unlike nationally, where the ANC’s 2019 decline must increase to drop below 50%, in the Free State it need only continue to decline at the same rate it did in 2019, and 50% and below becomes possible. It will also require an extremely powerful showing from the opposition, but it is possible.
If the ANC only slows its decline to a significant degree, 50% and below immediately become fantasies.
All numbers in this essay are drawn from the Independent Electoral Commission website: https://www.elections.org.za/pw/
This essay is the 9th in an on-going series on Election 2024, for all other editions of this series, please click here: Election 2024
