
A critical analysis of the 14th Commission for Employment Equity Annual Report
June 2014
The slogan emblazoned on the cover of the latest annual report by the Commission for Employment Equity (CEE) is: ‘Turning over a new leaf against all odds'. Unfortunately, when turning the pages of the report, it soon becomes clear that the CEE has not turned over a new leaf. The 14th CEE Annual Report, like its predecessors, once again provides an analysis that is confused at best and misleading and irresponsible at worst.
In his foreword to the report, the CEE's current chairman, Dr Loyiso Mbabane, laments what he describes as a ‘misdirected shoot the messenger approach' that has characterised some of the responses to previous CEE reports. The CEE is not a messenger that presents certain facts dispassionately as they are received. In reality, the CEE is the entity that constructs the message and presents it in a very specific way that, year after year, is erroneous in several respects. The version presented by the CEE cannot stand unchallenged. As the CEE is a statutory body that advises the Minister of Labour on issues relating to employment equity - issues that affect all South Africans - it is important that mistakes and erroneous analysis by the CEE are pointed out, lest such inaccuracies find their way into legislation, regulations and the implementation of policy.
The CEE's pronouncements also tend to inform the public debate on the sensitive topic of affirmative action. The CEE's role is to help other people who are not experts on issues of employment equity understand the dynamics in the labour market relating to employment equity. Unfortunately, the CEE does not fulfil this role and tends rather to reinforce the erroneous perceptions that already exist and creates new ones as well. Not all readers of the CEE's reports will realise that much of what the CEE says is inaccurate or misleading, as on the surface, most of what the CEE says in its reports appears reasonable. With this critical analysis of the CEE's 14th Annual Report, any reader of the report should be in a position to judge which parts of it have merit and which parts should be disregarded.
It remains disappointing that the CEE persists in publishing reports containing factual errors of a nature which the Solidarity Research Institute (SRI) has been pointing out since 2007. To make a few mistakes is normal, but to persist in doing so year after year after being corrected is inexcusable. As was the case in 2013, much of this erroneous and confused analysis was repeated and emphasised at the release of the report at the Employment Equity and Transformation Indaba in Sandton.
This critical analysis once again points out the errors of fact and interpretation errors that are discernable in the latest CEE Annual Report. It is possible to clearly show that the analysis the CEE presents of its own data is not accurate.
The analysis first deals with the ‘innovative' part of this year's report, where the Commission puts a strong emphasis on analysing the changes in actual numbers of people over time instead of percentages. The reasons why this approach is mathematically flawed and does not actually add anything of value to the discourse are explained.
The reasons why the composition of the economically active population (EAP) cannot be used as the only yardstick for judging whether ‘representation' is right or wrong are explained. The inherent uncertainties in the EAP figures are also briefly touched upon. This is followed by an explanation of why it is not a strange phenomenon that the percentage of foreign nationals appears to continually increase in the statistics.
The dynamics such as age differences, qualifications and experience required that characterise the top management level are explained. An analysis of average number of top managers per employer is also presented, which also goes a long way to explaining why there is still such a large representation of white people at this level of the labour market.
It is explained how, due to several different types of uncertainty in the data, it is futile to try to analyse marginal changes of a few tenths of a percentage point in the data, even though the CEE often tries to do this throughout the report.
In the penultimate section of this analysis, it is made clear that the conclusions which the CEE reaches in its analysis of various figures related to labour turnover are incorrect. The CEE compares these figures to the wrong yardstick and thereby reaches conclusions that are not valid. The analysis makes it clear that what the turnover figures actually show is the opposite of what the CEE claims.
Finally, various errors, ranging from figures that were copied and pasted incorrectly and other typographical mistakes to basic claims about the data that are not borne out, are highlighted. It would appear from these errors that the 14th CEE Annual Report was compiled in a rushed manner.
1. Actual figures versus percentages
The big ‘innovation' from the CEE in this year's report is the inclusion of a comparison of changes in actual figures over time rather than just a comparison of the percentages at which various groups are represented at the different occupational levels. On page 51 the CEE states:
An important addition this year is the actual numbers are provided over and above the percentages ... This changes the effect of the percentages drastically.
On pages 52 and 53 it continues with a laboured analogy which the chairperson of the CEE also employed during his presentation at the launch of the report:
What the real numbers reveal is that the "cake" has been expanding / increasing over the past ten years, but it has not transformed at the same rate as it has been increasing. We then have the biblical situation of even more being added to those to whom more representation had been given, whereas from those whose representation was less, lesser still will be added. To continue the cake analogy, the black raisins on the cake remain scattered here and there even as the cake continues to enlarge.
It would not be surprising if readers are hard-pressed to follow what is being said in this paragraph. To elucidate: what the CEE appears to be saying is that if, for example, the number of white people in top management increased by 2 318 from 2003 to 2013 while the number of African people increased by only 2 155 during the same period, then racial transformation has gone backwards.
During his presentation at the launch of the 14th CEE Annual Report, Dr Mbabane was at great pains to emphasise these figures and pronounced on how the numbers showed the real situation ‘hidden' behind the percentages. It was intimated that a larger number of white people newly entered into employment at the higher occupational levels during the period 2003 to 2013 than did black people.
Apart from not taking into account that changes in the absolute numbers are significantly affected by changes in the number of employers reporting and the percentage of reports that are included in the final report, the CEE is conflating two different issues here. First, however, the problem of the non-comparability of the two sets of figures should be explained further.
For its report for 2003, the CEE received reports from 3 252 employers, covering 3 340 199 employees. It included all of the reports in its final analysis, even though, judging by subsequent years, it is highly probable that many of the reports would have been incomplete and would have contained significant errors.
For its 2013 report, the CEE received reports from 5 102 employers, of which it deemed 97,7% complete and accurate enough to include in its final analysis. The final 4 984 reports covered 5 593 326 employees, 67,5% more than in the report for 2003. Now the question is whether this massive increase was due to a real increase in the labour market over the period, or whether it was simply due to a greater participation by employers.
It is difficult to compare labour market data over long periods of time in South Africa, as the surveys used to compile such data have differed significantly, making comparisons over time fraught with uncertainty. Even so, by comparing high-level figures from an official labour market survey in 2003 with one in 2013, it is possible to discern whether or not the 67,5% increase in the number of employees covered by the CEE's reports correspond to an actual increase in the number of employed people in South Africa.
In the revised Labour Force Survey (LFS) for September 2003, there were 11 959 000 employed people. Compared to the 15 036 000 in the Quarterly Labour Force Survey (QLFS) for the third quarter of 2013, it amounts to an increase of only 25,7%. Even if one were to speculate that larger employers may have increased employment faster than in the general labour market, it hardly seems likely that this increase would be nearly three times faster. It can therefore be concluded that the main reason for the 67,5% increase in the number of employees covered by the CEE's report was increased coverage of employers by the CEE, not an actual 67,5% increase in the number of people employed by large employers in South Africa in the last ten years.
It is therefore not correct to present the analysis as though the net growth in positions reflected in the CEE's reports means that thousands of people were newly employed during that period.
The correct figures to compare over time are indeed the percentages that the various groups contribute to the total employment at each occupational level. If one were to use the growth in actual numbers for a specific group, it would need to be compared to the growth rate of the entire occupational level (the average) and if the group's growth rate was higher than the average, it could be concluded that the group's representation at that level had increased. Just comparing the absolute increase in numbers of one group to another is not meaningful, except for purposes of drawing attention to the base (whether high or low) from which a specific group is growing. Once again, though, comparing percentages accomplishes that as well.
To use the CEE's cake analogy: A baker wants to bake a delicious cake filled with raisins. To test his recipe, he first bakes one cake which contains two cups of flour and half a cup of raisins. After tasting a slice, he judges this cake to be unsatisfactorily raisin-poor. He therefore bakes another, larger cake which contains four cups of flour and two cups of raisins. If he eats a slice of this cake, will he be more, or less inclined to approve of the quantity of raisins the slice contains? The answer should be obvious: the slice from the larger cake will contain proportionally more raisins than the slice from the first cake. The baker has moved closer to his objective of baking a cake containing a large proportion of raisins.
However, if one were to follow the CEE's approach of looking at absolute numbers in isolation, it would appear that from the first cake to the second, the flour increased by two cups, while the raisins only increased by one and a half cups. In absolute terms, therefore, the raisins increased by a smaller measure than the flour did. Still, the fact remains that the second cake is richer in raisins than the first, which was the objective of the baker.
In its reports, the CEE is interested in measuring the extent to which the representation of people from designated groups has increased in the workplace at various levels. The way in which to do so is to simply compare changes in the percentages that the various groups represent. It is baffling why the CEE is now trying to make increases in the representation of people from designated groups appear as though they are actually not really increases.
Comparing changes in the absolute numbers is not a ‘nuanced approach' that helps us to ‘understand the reality'[1]. It only serves to confuse the issue and to obfuscate the real trends that can be discerned from the data.
The following two tables, with data drawn directly from the CEE's own reports, shows the actual changes in representation of the designated vs. non-designated groups from 2003 to 2013.[2]
|
Entire designated group (including white women) |
Non-designated group (white men) |
||||||
|
2003 |
2013 |
Change (percentage points) |
2003 |
2013 |
Change (percentage points) |
||
|
Top |
32,5% |
43,5% |
+ 11,0% |
67,5% |
52,3% |
- 15,1% |
|
|
Senior |
42,2% |
55,7% |
+ 13,5% |
57,8% |
41,3% |
- 16,5% |
|
|
Professional |
65,7% |
72,7% |
+ 7,0% |
34,3% |
24,9% |
- 9,5% |
|
|
Skilled |
78,1% |
86,5% |
+ 8,4% |
21,9% |
12,0% |
- 9,9% |
|
|
Semi-skilled |
94,1% |
94,7% |
+ 0,6% |
5,9% |
2,6% |
- 3,3% |
|
|
Unskilled |
98,6% |
96,1% |
- 2,5% |
1,4% |
0,7% |
- 0,7% |
|
It is abundantly clear that the designated group has increased with respect to representation, while the non-designated group has decreased at all levels. The reason why the percentage point changes do not equal each other is because of the inclusion of foreign nationals, which also accounts for the apparent anomaly at the unskilled level, where both the designated and non-designated groups' representation decreased.
|
Total black group |
White men and women |
||||||
|
2003 |
2013 |
Change (percentage points) |
2003 |
2013 |
Change (percentage points) |
||
|
Top |
23,7% |
33,2% |
+ 9,4% |
76,3% |
62,7% |
- 13,6% |
|
|
Senior |
27,3% |
40,1% |
+ 12,8% |
72,7% |
57,0% |
- 15,7% |
|
|
Professional |
50,7% |
57,4% |
+ 6,6% |
49,3% |
40,2% |
- 9,1% |
|
|
Skilled |
61,8% |
76,4% |
+ 14,6% |
38,2% |
22,0% |
- 16,2% |
|
|
Semi-skilled |
84,8% |
90,6% |
+ 5,8% |
15,2% |
6,7% |
- 8,5% |
|
|
Unskilled |
97,7% |
95,8% |
- 1,8% |
2,3% |
1,0% |
- 1,4% |
|
Even if one only considers the black group instead of sticking to the definition of the designated group in the Employment Equity Act, a very similar picture emerges: significant increases in the representation of black people at all levels (except the unskilled level) matched by decreases in the representation of white people.
These two tables clearly show the actual differences in racial representation as measured by the CEE in 2003 and 2013. It also shows that, especially at the top and senior levels, black people's increases, though significant, come from a low base. Referring to the changes in the absolute numbers serves no purpose other than to obscure that which is shown in these two tables.
Comparing statically, of course, at most levels, the designated group's representation still lags behind this group's share of the economically active population (EAP). However, as is pointed out in the next section of this critical analysis, the EAP cannot be used as a yardstick for measuring racial transformation in isolation.
2. The economically active population - an incomplete and flawed yardstick
The composition of the economically active population (EAP) with respect to race and gender is the one and only yardstick that the CEE uses for measuring the extent to which any specific occupational level is ‘representative' or not.
There is a very good reason why the composition of the EAP is used instead of the composition of the total population. The economically active population consists of everyone aged 15 to 64 who are either working, or looking for work. This is the broadest possible group of people from which any employer can be expected to employ people. An employer cannot employ a child of ten, nor somebody who has decided to study full time or somebody who has decided to forsake a career entirely in order to raise his or her children. It therefore would not make sense, it would in fact be completely unreasonable, to expect employers to employ people from the entire population rather than just from the economically active population.
With this principle as a precedent, it then also follows that other factors may also influence the pool of people who are qualified for specific positions. For instance, a specific position may require ten years' experience, which would mean that very few, if any, people under the age of 30 would be suitable for the position. A women's rugby club can, for obvious reasons, only employ women as rugby players. Consider a position for a translator who would be tasked with translating documents from Afrikaans into English. Such a position would be restricted, at the very least, to people who are fluent in both English and Afrikaans. An airline's choice of people to employ as pilots is restricted to people who have the requisite training and experience in accordance with the applicable legislation and internal safety regulations. In another instance, a job may include driving a company car, in which case it would be restricted, at least, to people with driver's' licences.
Some of the factors that have been mentioned, for example age and gender, are impossible to change. Others, like learning a language or getting a pilot's license, take many years to change, while others, like getting a driver's license, can be changed more rapidly, but still require significant time, money and effort.
The truth is that characteristics, skills and qualifications like these are not evenly distributed along race and gender lines - it is not the case in any society in the world and is certainly not the case in South Africa. One may choose to lament this state of affairs, but it remains the reality. In South Africa, certain of these differences in the distribution of various characteristics relevant to employment are partly or wholly the result of discriminatory practices of the past. Most of the distributions that differ due to this reason are changing, partly because of the efforts of employers who go out of their way to offer opportunities like free driving lessons to employees without driver's licenses, or other types of training, but it takes time for such changes to take place.
The following example illustrates this point: In a specific country there are 100 000 doctors, 80 000 of whom are white and 20 000 of whom are black. The country's general race distribution is 80% black and 20% white, however. Now suppose that each year, 2 500 doctors leave the profession due to death or retirement, while 5 000 new doctors qualify and start practising each year. Of the 2 500 doctors who retire, 2 000 are white and 500 are black, while of the 5 000 doctors who newly qualify, 4 000 are black and 1 000 are white.
If this continues for 20 years, what would the racial composition of the entire group of doctors then be? The result is, that after 20 years, there would be 150 000 doctors in total, 90 000 of which would be black and 60 000 white, a 60/40 split - still not reaching the 80/20 split of the general population.
Therefore, even though each cohort leaving the labour market and each cohort entering may have characteristics significantly different from the characteristics of the labour market as a whole, it still takes a long time for the labour market as a whole to change. It is like adding hot water to a cold bath - it takes time for the bath's temperature to change significantly.
For as long as the distribution of qualifications, skills, experience and other relevant characteristics remains different from the general race and gender distribution in South Africa, the composition of the EAP cannot be used as the one and only yardstick by which to measure racial and gender transformation.
Apart from the EAP not being suitable as a yardstick because it does not take into account differences in the distribution of various relevant factors that are impossible or inherently slow to change, it also suffers from some other, inherent flaws.
The EAP is derived as part of the Quarterly Labour Force Survey (QLFS) that is regularly undertaken and published by Statistics South Africa (Stats SA). As the QLFS is a sample survey, it has certain margins of error. The figures that are published are uncertain estimates, not pinpoint-accurate numbers. The uncertainty increases as the population is split up by variables such as population group or geographical location.
In its estimates and in the final published figures, the QLFS also makes absolutely no distinction with regard to citizenship or any other such factor that has a bearing on whether a person is part of the ‘designated group' or not. For example, the ‘black African' category in the QLFS includes any ‘black African' immigrant who entered South Africa after 1994. Such people are not included in the ‘designated group' as defined in the Employment Equity Act, but are considered to be ‘foreign nationals' even if they have subsequently acquired South African citizenship.
Due to uncertainties such as these, the EAP figures cannot be used as a rigid yardstick. If it is known that the yardstick is uncertain, it is not reasonable to apply it in a rigid fashion.
3. The increase in foreign nationals
In the 13th CEE Annual Report much was made of the increase in the representation of foreign nationals at various occupational levels and it was intimated that this phenomenon may be part of the reason why the increase in the representation of black people at various occupational levels is only gradual.[3] Although this idea does not appear as prominently in the 14th CEE Annual Report, it is still worth pointing out that there is nothing sinister behind the continual increase in the representation of so-called foreign nationals at higher levels in the South African labour market. There are two reasons for this, one somewhat speculative and the other a simple, logical reason.
It is probable that part of the apparent increase in the representation of foreign nationals at higher occupational levels is simply due to more accurate reporting on this variable than before. Employers may now be more aware of when someone is to be regarded as a foreign national for purposes of employment equity than they were before, leading to some people who previously would not have been included in the category, being included now.
Simple logic also dictates that the proportion of foreign nationals will continue to increase in the statistics. This is due to the fact that, for purposes of employment equity, people who have acquired South African citizenship after 27 April 1994 remain ‘foreign'. Someone who settled in South Africa in 1995 and has long since taken up South African citizenship still falls in the foreign national category in the CEE's reports. Therefore, as long as there is net immigration into South Africa, one would expect the proportion of ‘foreign nationals' in the CEE's reports to increase steadily.
4. Actual dynamics at top management level
The CEE, as well as many people who quote from the CEE's reports, focus strongly or even exclusively on the data regarding the top management level. This is the level that shows, throughout the years, the highest proportion of white people in general and white men in particular. In the latest report, 62,7% of top management consists of white people and 52,3% of white men. The big discrepancies between these figures and the proportions of the economically active population (EAP) that consist of white people and specifically white men are then usually emphasised.[4] One does not often, if ever, see the CEE referring to any factors that may be relevant to explaining these large discrepancies. The discrepancies are usually explained simply by vague claims attributing them to ‘resistance to transformation'.
In fact, there are two basic variables that go a long way toward explaining why white people are represented so strongly at top management level: formal qualifications and experience. Nobody would deny that these two factors play a very important role in whether someone can function effectively in a top management position (or any position, for that matter). This reality cannot be wished away.
Formal qualifications are not evenly distributed through the South African population, as the following graphs show:[5]
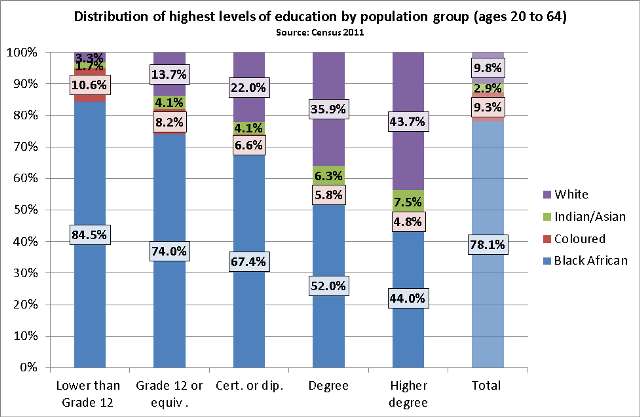
***
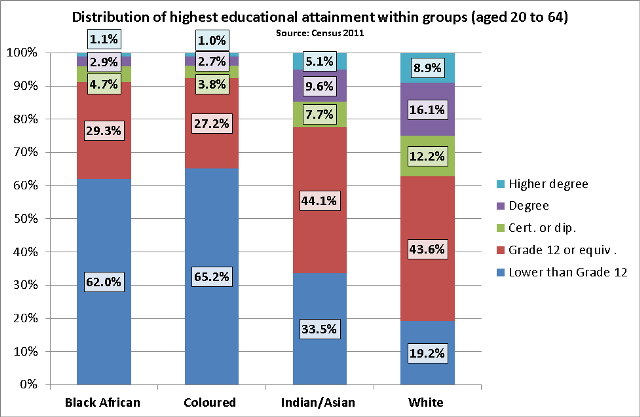
Particularly the white and Indian/Asian population groups in South Africa generally have much higher educational attainment than black African or Coloured people. This is gradually changing as older people retire and the qualification profile of younger black African and Coloured people improves.
From the graph it is clear, however, that the race profile of the population with degrees or qualifications higher than degrees differs considerably from the race profile of the entire EAP. Most top management positions, especially in larger companies, require at least a university degree.
At this juncture the myth that there are hundreds of thousands of young unemployed university graduates in South Africa should be dispelled. This myth is often repeated in the media, without any thorough scrutiny of such claims.
The Quarterly Labour Force Survey unfortunately does not separate different types of tertiary qualifications into categories, so it is difficult to know how many people who are unemployed in the QLFS actually have university degrees. In the QLFS for the third quarter of 2013, it was estimated that 326 000 people (of all ages) with any form of tertiary education were unemployed. This figure is probably where the myth of massive university graduate unemployment comes from, but ‘tertiary' includes much more than only university graduates here.
One other data source that can shed further light on the issue is the 2011 Census. Although not generally used as a robust source for data on unemployment, because censuses tend to overstate the extent of unemployment, in this case it proves instructive. In the census, among people aged 18 to 64 with a university degree or an equivalent (or higher) qualification, the total number of unemployed people was only 101 460. Of this group, only 53 241 were under 30 years old. Of the group of 53 241 young, unemployed graduates, about 10% were white and about 90% were black. This puts paid to the notion that there are massive numbers of unemployed, young, black graduates who could be employed at management levels in companies.
Another requirement inherent to most, if not all top management positions, especially in large companies, is work experience, both in general and specifically relating to management. Unfortunately, no figures on work experience at different levels are available, but it is reasonable to assume that most black people have less work experience at higher levels than their white colleagues of the same ages. In many cases, especially regarding the generation currently older than 50 years, this would be in large part due to the discriminatory policies of the past. Even so, though, this discrepancy in experience is also not something that can just be wished away - it is a real difference that takes time to change. It is not, as the Minister of Labour said in her speech at the release of the CEE report, just a ‘clever word'.
In relation to experience, the differing age structures (the so-called age pyramids) of the various population groups also plays a role. About 60% of the black African population of working age is younger than 35 years old, while the situation is switched around for the white population, with more than 60% of the white, working-age population being older than 35. Consequently, even if there had not been any discriminatory policies in the past, the average number of years' experience among the white population would still be higher than that of the black African population. This is simply due to the different age profiles among the different population groups - once again a factual issue that cannot just be ignored when analysing employment equity data.
Focusing on the top management level also requires further consideration of an important dynamic at this level - the small number of people at top management level within each firm.
In the latest CEE report, which covers only employers with 150 or more employees, the number of people at top management level was only 22 571 in the 4 984 firms covered by the report. The average number of top managers per large firm was therefore only 4,5. Taking into consideration that some of the very large firms would have more people at top management level, possibly up to 10 or 15 people, it means that many of the firms covered by the report would have only one, two or three people at top management level.
What this means is that, on average, many large firms cannot bring down the representation of white men in top management down lower than 100%, 50%, 33% or 25%, unless they employ no white men at all at top management level.
Take for example a fictional firm called Swanepoel Transport that was built up to a large employer with 200 employees over the years. It is a family-run logistics firm with only one position at top management level, filled by the patriarch of the Swanepoel family, a white man. The firm is therefore 100% white and male at top management level. The only way in which to change this would either be for Mr Swanepoel to step down and employ someone else to run the business, or to create an additional top management position - neither scenario in keeping with the family-oriented nature of the business. Even if another top management position were to be created and a black person employed in the position, the firm would still be 50% white at the top level.
It is speculative, but seems likely that much of what is regarded as ‘resistance to transformation' is simply a consequence of the fact that most firms, even large firms, have only a handful of top management positions. Surely, if a white person starts a business as owner and manager, it cannot be regarded as ‘resistance to transformation' if the company's only top management position is 100% white! Coupled with the white population's favourable age distribution and attainment of formal qualifications, it should not be at all surprising that the representation of white people in top management remains high. To a somewhat lesser extent, this principle would apply to the senior management level as well, as most firms with only one or two people at top management level would probably not have more than four or five employees at senior management level.
In general, there is another reason why white representation at higher occupational levels has been slow to change: people who have once been employed at a specific occupational level rarely move downwards again. It is very rare that someone who is employed at a senior management level will voluntarily leave that position in order to take up another position at a lower level. Realistically, the only reason of any significance for such a move would be if it were from a small firm to a very large one. Being a junior manager at a very large company may offer better pay and more prestige than being a senior manager at a small company. Mostly, however, people tend to voluntarily only move sideways or upwards in the occupational hierarchy, not downwards. This dynamic is discussed more fully in the section on labour turnover.
In any event, focusing on the top management level and using what happens there as justification for implementing policies that affect the entire labour market is somewhat cynical. In the latest CEE report, the 22 571 people at top management level constitute only 0,4% of the entire number of employees covered by the report. This number pales in comparison to the 8,2 million unemployed people in South Africa.
5. Analysis of marginal changes at higher levels ill-advised
Throughout the report, the CEE often refers to marginal changes of a few tenths of a percentage point to indicate apparent ‘regression' of designated groups from 2003 or 2005 to 2013. This approach is ill-advised, due to the limitations of the data that the CEE collects. While improvements in reporting have been made in the last few years due to a digital reporting system having been implemented, the earlier reporting years were characterised by significant fluctuations in the number of employers reporting as well as the number of reports the CEE included in the analysis, as the following table shows:
|
Reports received |
Reports included |
Percentage included |
|
|
2003 |
3 252 |
3 252 |
100% |
|
2005 |
2 085 |
2 085 |
100% |
|
2007 |
2 858 |
1 493 |
52,2% |
|
2009 |
3 695 |
3 369 |
91,2% |
|
2011 |
4 492 |
4 370 |
97,3% |
|
2013 |
5 102 |
4 984 |
97,7% |
From the first column it is clear that the number of reports received fluctuated greatly over the years. In 2003, more than 3 000 reports were received, followed by barely more than 2 000 in 2005. It is not possible that this fluctuation was due to a real change in number of large employers in the South African economy, as there was no significant economic upheaval in the intervening period that could have caused more than 1 000 large firms who had previously reported to close their doors. In both of the years, however, the CEE included all of the reports it received in its analysis, regardless of whether or not the forms submitted were complete or substantially accurate.
In the following year, 2007, the CEE once again received close to 3 000 reports, but only included fewer than 1 500 of those reports in its analysis - the other reports being deemed too incomplete or inaccurate for inclusion. In 2009, however, both the number of reports received and the percentage of reports included increased significantly. This trend continued in 2011 and 2013.
It ought to be abundantly clear that comparisons made between data for different periods, with the possible exception of a comparison between 2011 and 2013, will be affected by the inconsistency in the completeness and accuracy of the reports received and included by the CEE. This inconsistency would especially affect the higher occupational levels where fewer people are employed. It would be responsible of the CEE to make readers of its report aware of this throughout the report - that too much should not be read into small fluctuations in the data over time.[6] However, the CEE does not even mention this in its report and proceeds as though the data for all of the years were perfectly accurate and directly comparable to all other years and then makes sweeping conclusions on the basis of marginal fluctuations in the data.
A further variable that affects the comparisons over time is the inclusion of the category of ‘foreign nationals' from 2007. Although this is a fairly small category, its inclusion does undoubtedly have an impact on comparisons. The CEE does include a note in its report drawing attention to this fact, but then proceeds without any further reference to it in its own conclusions on small fluctuations in the data.
Lastly, the figures in the CEE's reports are all rounded to the nearest first decimal. This rounding does not appear to have been done consistently over time. If one uses the raw data from previous CEE reports and compares it to figures in the 14th CEE Annual Report, it often differs by one or two decimals. Ordinarily, this would not be a significant problem, as one would not make profound conclusions on the basis of a decimal or two. However, the CEE often does make such conclusions in its report, apparently without realising that some of these differences which it regards as being a significant indicator of resistance to racial transformation could simply be explained by mathematical rounding.
Despite these issues, the data should still show general trends over time, especially when larger groups are under scrutiny, as the actual trends in the data would then outweigh the fluctuations caused by incomplete reporting, the inclusion of foreign nationals and rounding. The lack of precise comparability over time due to the abovementioned factors does, however, still have a significant impact on what is discussed in the following section of this critique.
6. Turnover figures incorrectly presented
Once again, a section on how the CEE completely misinterprets its own figures on labour turnover has to be included in the report. Despite the SRI pointing out the errors in the CEE's approach for four years running, and having had a discussion with the Commission about the issue, the CEE persists with this misrepresentation of its own figures.
The CEE uses the racial composition of the economically active population (EAP) as the only yardstick for measuring all of the figures in its reports. According to the CEE's approach, if any figure for white people is higher than the white share of the EAP, it is an ‘overrepresentation' caused by ‘resistance to transformation'. The CEE follows this approach in its analysis of figures on recruitment, promotions and skills development.
The figures on skills development contained in the CEE's reports are difficult to use, due to the way in which information is collected by Form EEA2. The question regarding skills development is phrased as follows:
Please report the total number of people from the designated groups, including people with disabilities, who received training solely for the purpose of achieving the numerical goals, and not the number of training courses attended by individuals. (Emphasis added)
It is not clear how this should be interpreted. What qualifies as training ‘solely for the purpose of achieving numerical goals'? The logical interpretation would be that it refers to training given to employees from designated groups (or ‘underrepresented' groups) to enable them to be promoted to more senior positions. If this is true, there should be no, or very little, training reported for white men, contrary to the actual figures in the report. It is therefore clear that a large number of companies, probably a majority of companies, do not interpret the request on Form EEA2 in this way. This renders the usability of these figures even more tenuous than the rest of the figures in the report.[7] Regardless, the CEE continues to use the figures in its reports and they are therefore also included in this critical analysis.
The following is an example of the CEE's approach in interpreting recruitment and promotion figures. On page 35 of the report, the following figures appear:
|
White men |
Black men and women |
|
|
Employed |
41,3% |
40,1% |
|
Recruitment |
36,2% |
44,8% |
|
Promotion |
28,9% |
52,9% |
|
Skills development |
32,7% |
49,6% |
Comparing these figures to the EAP proportions of less than 7% for white men and nearly 89% for black men and women as a group, the CEE concludes that: ‘Whites ... are more likely to be appointed, promoted or exposed to training at the Senior Management level,' and: ‘The existing patterns only indicate that inequities in the representation of race ... at this level will remain for a number of decades to come.' These conclusions are invalid, because the base of comparison is incorrect. The figures on workforce movement should not be compared with the EAP, but with the existing distribution of employment at the specific occupational level.
The possible pool of people to promote or who could receive training is not the entire economically active population, but only the people who are currently employed at the specific occupational level. Therefore, if the proportions of recruitment or promotion for a specific group, for example white men, are lower than the group's existing share of employment at that level, it indicates that a white man has a less than average likelihood of being promoted or receiving training at that level.
By the same token, the fact that only 36,2% of recruitments into senior management were white men during 2013, while the existing proportion of senior management accounted for by white men was 41,3%, indicates a gradual decrease of white male representation at this level. This should not be surprising, as it is exactly what the long-term analysis of the CEE's employment data also shows.
To illustrate the principle, the following hypothetical example can be constructed:
Consider a situation where a company has 1 000 employees at senior management level. Of these 1 000 employees, 700 are white and 300 are black. Now the company promotes 100 employees. Of those that are promoted, 60 are white and 40 are black. The CEE would look at this division and conclude that white people are more likely to be promoted than black people and that white people are getting more than their fair share of promotions. This conclusion is factually incorrect.
Actually, in this example, each individual black person out of the 300 is more likely to be promoted than each of the 700 white people. Forty promotions out of 300 means that 13,3% of the black people were promoted, while only 8,6% of the white people were promoted.
This situation is exactly what one can generally observe in the figures in tables 11, 18, 25 and 32 from the 14th CEE Annual Report:
|
White men |
||||
|
Currently employed |
Recruitment |
Promotions |
Skills development |
|
|
Top |
52,3% |
37,1% |
42,3% |
41,2% |
|
Senior |
41,3% |
36,2% |
28,9% |
32,7% |
|
Professionally qualified |
24,9% |
19,8% |
16,4% |
18,3% |
|
Skilled |
12,0% |
12,7% |
6,1% |
11,8% |
In almost all cases, recruitment at the skilled level being the only exception, the figures on recruitment, promotion and skills development actually indicate the gradual erosion of white male representation at the top four occupational levels. In most cases, the margins of difference are significant.
The irrationality of the CEE's approach to workforce movement figures can be illustrated by a further simple example:
In a company, there are 35 black people and 65 white people at a job level. In one year, the company decides to promote all 35 black people. If they were to adhere to the EAP proportions, this would mean that they could promote only five white people in that year, to achieve (roughly) an 88/12 split. This would keep the CEE happy and the net effect of the change would be that 40 employees were promoted.
However, if the company instead decided to still promote all 35 black employees, but also promoted 35 white employees instead of only five white employees, the split would change from 88/12 to 50/50. This would not sit well with the CEE. However, did anything negative actually happen? Were any black people disadvantaged by this decision? Of course not. All of the black people were treated exactly the same in both examples.
The only difference was to the white employees, who, in the second situation, were positively influenced without disadvantaging anyone else. Still, according to the CEE's approach, the first situation, where only 40 employees instead of 70 benefited from promotions, would be preferred. If one were to, as the CEE does throughout its report, use the composition of the EAP as the only yardstick by which to judge the fairness and desirability of the two alternatives above, the first example would be judged fair and equitable, even though the second alternative treated all the black employees exactly the same, but increased the net positive effect on employees. The CEE's approach is similar to the Aesopian fable of the dog in the manger.
At a level concerning individual dignity and fairness, a strict adherence to the composition of the EAP as the only yardstick also creates problems. Continuing the previous example, at a group level, the promotion of 35 black and five white employees would be ‘fair' if judged only by the composition of the EAP. However, if there were actually ten white employees who were all equally deserving of a promotion because of their hard work and dedication, only five could be promoted, following the EAP composition. The other five would have to be told that, due to ‘equity', they could not be promoted.[8]
There is another simple, but important aspect to employee turnover that the CEE fails to mention in its report. People who are employed rarely leave their positions voluntarily unless they have a prospect of being employed at a similar or higher level elsewhere. This is the case even more so at managerial levels. People who have advanced to senior management positions will generally not leave those positions unless they are promoted to top management or secured employment at other employers at a senior or top management level. Because of this, the same individuals were probably double-counted in most of the CEE's figures on ‘terminations' of employment (unpublished in the last two years' reports) and of recruitment of new employees. Someone is ‘terminated' at one company, but the reason for that ‘termination' is because the person has already secured employment at a similar or a higher level at another company.[9] It is therefore not reasonable to suggest that every ‘termination' of a white employee automatically creates, on a net basis, a vacant position that, if not filled by a black person, means that there is ‘resistance to transformation'.
This section of the critical analysis lists various unrelated errors or dubious statements found in the 14th CEE Annual Report. Some of these errors are also referred to in other sections of this analysis.
1. In a change from last year, the chairperson of the CEE did not make any glaring factual errors in his foreword to the 14th CEE Annual Report. However, on page 7 of this year's report, reference is once again made to the apparent ‘random walk phenomenon' that was highlighted by the chairperson in the previous report. It is stated that ‘there is no consistency in the up or downward trend ... in the representation of designated groups.' The SRI showed that this assertion by the CEE was erroneous and merely a result of incorrect data in one of the tables in the 2013 report.[10] When the correct data is used, a consistent upward trend emerges.
2. On page 13, the CEE includes a table with the most important yardstick it uses for measuring racial transformation - the race and gender composition of the national economically active population (EAP). It draws these statistics from the Quarterly Labour Force Survey (QLFS) for the third quarter of 2013. In Solidarity's experience, many employers, regarding the CEE as a trustworthy source, simply reproduce these tables directly from the CEE reports in their employment equity plans. It is therefore important that these figures be correct. Unfortunately, the figures in the table are incorrect. Referring directly to the third quarter of 2013's QLFS, the percentage of the EAP that consisted of white people was 11,1% and not 10,8% as reported by the CEE. The discrepancy is larger than could be explained by rounding.
3. Pages 15 to 22 contain eleven graphs purporting to display the historical CEE data from 2003 to 2011 and current data for 2013. All eleven of these graphs are erroneous. The graphs do not visually match the data contained in the tables below them. It appears as if the graphs correspond with the data from the CEE report released in 2014 and were not updated, even though the data in the tables below each graph were updated.
Errors also exist in the data in the tables below each graph. On page 16, below figure 3, it is stated that white representation at senior management level in 2007 was 65,0% when, in fact, the original CEE report for that year puts it at 65,2%.
The figure of 2,0% given for foreign nationals in 2009 should, in fact, be 2,6%.
For 2011 a figure of only 12,8% is given for Africans at senior management level, when, in fact, the first two digits should be transposed as the actual figure was 21,8%.
On page 17, in the text box near the top of the page, the percentage change reported for white people at senior management level from 2003 to 2013 is 19,6%. The figure that should actually appear there is 39,6%.
Also on page 17, below figure 5, it is stated that in 2005, African representation at the professionally qualified level was 38,8%, while it was in fact 21,4% in that year. The 38,8% figure appears to have been drawn from the skilled level for that year.
On page 18, below figure 7, the entire column for 2009 contains erroneous data. The data displayed there are for 2011, not 2009.
On page 22, all three of the graphs do not correspond with the data that they purport to show. It appears that these graphs were also duplicated from the previous CEE report and used in this year's report without any changes to reflect the new data.
4. Page 28 contains a statement on how, if current observed trends continue, ‘the status quo of inequity is bound to remain for at least a century'. On page 35 the section relating to senior management is concluded with a similar statement, verbatim from 2013's report, to the effect that ‘inequities in the representation in terms of race, gender and disability ... will remain for a number of decades to come.' In 2011 and 2012, the SRI showed the flaws in the CEE's analysis relating to similar statements[11]. It is unfortunate that the same inaccuracies appear again in 2014's report.
5. On page 52 it is stated that, with regard to Coloured people at top management level, ‘there is regression, not progress'. This inference results from a very selective view of the data, apparently only focusing on two years in which the representation of Coloured people at top management level declined by thin margins. In fact, according to the CEE's own data, the representation of Coloured people at top management level has never been higher than it was in 2013. Surely, this cannot be portrayed as ‘regression'?
6. On page 53 attention is drawn to the decline in African representation from 39% in 2003 to 38,4% in 2013 at the professionally qualified level. Looking at the historical data, this does appear to have been the case. However, there appears to have been significant problems with accuracy and consistency of data at this level in 2001, 2003 and 2005 in the CEE's reports. The figure for African representation fluctuates from 12,8% to 39% to 21,4% in these three years. These magnitudes of change are impossible in reality, leading the SRI to believe that there must have been some errors in the data for 2003. Not having access to the raw data, it cannot be confirmed beyond any doubt, but it appears very likely.
7. On page 53, under the "Skilled Level" heading at the second paragraph (labelled C for some reason), instead of data on the skilled level, text from the previous section relating to the professionally qualified level is repeated.
The 14th CEE Annual Report does not represent a new leaf that has been turned over. Once again, virtually all of the analysis in the report is flawed, most of it seriously so. Instead of analysing the data it collects in a dispassionate way, it seems that the CEE decides beforehand what it wants to say and then says it, regardless of what the data actually show.
The main flaws with this year's CEE report are briefly summarised below:
1. The ‘innovative' idea of using differences in actual figures over the years as opposed to percentages does not add any value and is simply a way of obfuscating the real changes that have taken place. The cake analogy as used by the CEE demonstrates a lack of understanding of how proportions actually function.
2. The CEE continues to use the composition of the economically active population (EAP) as its only yardstick for measuring all other figures against. It CEE also does not mention that, apart from often being unsuitable, the EAP in itself is a flawed measure in various respects, which means that even where it is suitable, it cannot be used in a strict mathematical manner.
3. The CEE continues to highlight the increase in the representation of ‘foreign nationals' without offering the readers of its report the two simple explanations for this phenomenon, namely: more complete reporting by employers and the way ‘foreign nationals' are defined for these purposes.
4. The way in which figures for the top management level are analysed and used in the CEE report leaves much to be desired. Instead of placing the dynamics at top management level into their proper context of small numbers per firm, differences in age and qualification profiles, the CEE simply compares figures to the EAP and reaches incomplete conclusions.
5. The report includes many instances where the CEE uses marginal changes of a few tenths of a percentage point in representation to draw specific conclusions. Such an approach has to be underpinned by figures that are extremely accurate, which is not the case for the CEE's figures. Its analysis of marginal changes is therefore misguided.
6. Though this error has been pointed out to the CEE in person in the past, it continues to misinterpret and misrepresent its own figures on recruitment, promotion and skills development. The CEE avers that these figures show that white people are being favoured in these respects at almost all occupational levels, while the exact opposite is in fact true.
7. There are various numerical, typographical and ‘copy and paste' errors in the report. These errors cast doubt on the care and diligence with which the report was compiled.
While the data included in this year's CEE report, as well as in previous reports do have their uses, readers of the reports would be well advised to be sceptical of the CEE's analysis of its own data.
Footnotes:
[1] Refer to the last paragraph on page 53 of the 14th CEE Annual Report.
[2] As these figures are drawn from the CEE's reports without modification, they do of course suffer from various problems regarding comparability over time, as detailed in this document. However, the purpose of the tables is to show that the conclusion the CEE should actually reach is that representation of designated groups is increasing significantly.
[3] Refer to pages 8 to 10 of the Solidarity Research Institute's 2013 critical analysis of that year's CEE Annual Report.
[4] Much less is made of the respective 13,6 and 15,1 percentage point decreases in the past decade at this level for the two groups.
[5] See section 5 of the SRI's critical analysis of the 13th CEE Annual Report for more information on this topic.
[6] On page 19 of the report, the CEE does mention that employers not fully or accurately reporting and a decrease in the number of employers reporting probably skewed the figures for people with disabilities in certain years. This makes it even more surprising that the CEE apparently does not think that this factor could be the explanation for some of the other somewhat strange fluctuations in its data over the years.
[7] As in 2013's report, the CEE, for reasons that are not clear, again neglected to include figures on terminations of employees in this year's report, despite the definition of ‘workforce movement' in the report still referring to terminations as being one of the relevant aspects.
[8] A real-world example of a situation like this can be found at the moment in the South African Police Service, where the promotions according to the new rank system were carried out strictly according to a race demographic composition and hundreds of white police officers could not be promoted due to this strict application of an unfair principle.
[9] Some exceptions would obviously be people vacating employment due to retirement, death, emigration or dismissal due to serious misconduct or criminal behaviour.
[10] Refer to page 5 of the Solidarity Research Institute's 2013 critical analysis of that year's CEE report for the detail concerning the CEE's error as well as further background information regarding trends in the data.
[11] Refer to page 4 of the SRI's 2012 brief critical analysis of that year's CEE report for more information.
Issued by the Solidarity Research Institute, June 2 2014
Click here to sign up to receive our free daily headline email newsletter
