
Can the ANC avoid falling below 50% in Gauteng?
7 February 2024
This essay uses the same framework as Essay 5 in the series (“Why it is so difficult to get the ANC below 50%”). So please read that if you are interested in the methodology, in more detail.
President Cyril Ramaphosa recently said of his party’s prospects in Gauteng, “The ANC is going to get more than 50%. This province is the home of the ANC. As I have been going around, people have been saying they belong to the ANC. We are confident. I can feel the pulse of the people, and I can smell it. Whether people like it or not, the ANC is going to come back with a bang.”
That is a bold statement given the dire condition of the ANC’s vote in the province. Let us see what the numbers say.
The big picture: Below is a graph of the ANC’s support in Gauteng, for each provincial and local election since 1999.
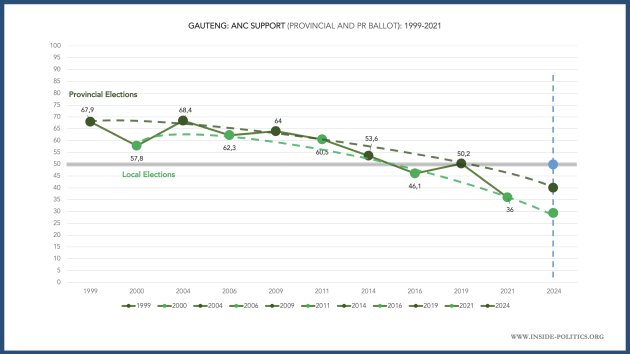
As you can see, the ANC does better in provincial elections (dark green), worse in local elections (light green – where it has twice fallen below 50%). As of 2019, it sits precariously on 50,2% of the vote. If we create a crude line projection for those trends (the dotted lines), the party seems headed for significantly below 50% on the provincial ballot in 2024 – if historical trends hold.
But that is just an ad hoc estimation. To produce a series of more scientific turnout scenarios, we need to know several key indicators in the province. These are:
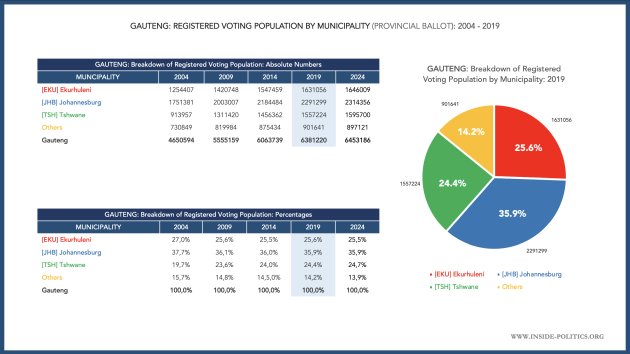
The registered voting population,
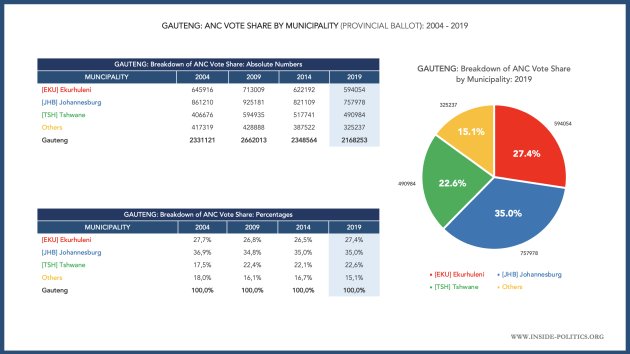
ANC support (in percentage and absolute numbers),
Turnout, and
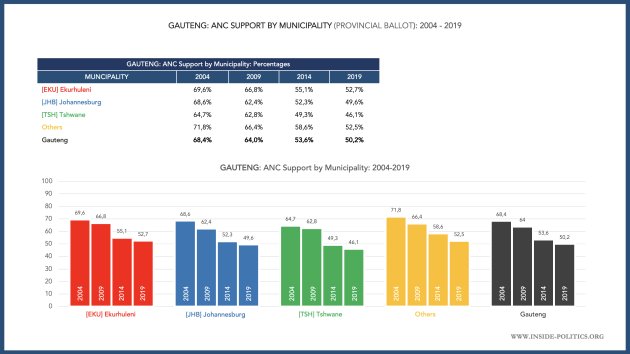
The ANC’s support as a percentage of all registered voters.
The following five tables below set that all out. They do this down to municipal level because it is important to understand if any of these indicators fluctuate wildly from one municipality to another, when we do our turnout modelling.
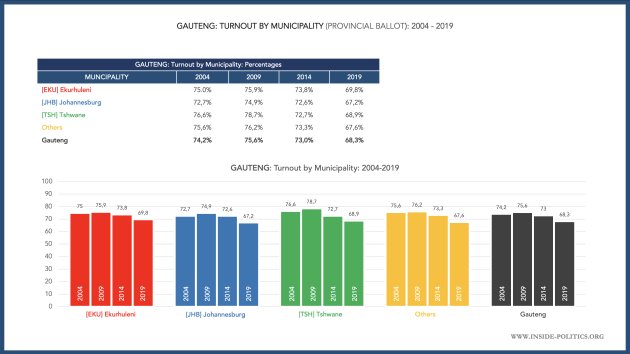
Three methodological notes before we continue:
The municipal boundaries in Gauteng have changed over the years. All the numbers above have been corrected for historical change (for example, if two smaller municipalities were merged into a bigger one – they are added to the bigger one’s total retroactively). I won’t bore you with the details, if you are interested, the Gauteng City-Region Observatory has an excellent article setting it all out.
All municipalities outside of the three metros have been grouped together (“Others”). They are: Emfuleni, Midvaal, Lesedi, Mogale City, Merafong City and Rand West City.
The IEC concluded the second voter registration weekend on 4 February, so we really have an almost complete set of registered voters now. There will be some small changes before the election but nothing significant.
Below is a summary of the key takeaways we need from those five tables above, that allow us to define the parameters of our turnout scenarios.
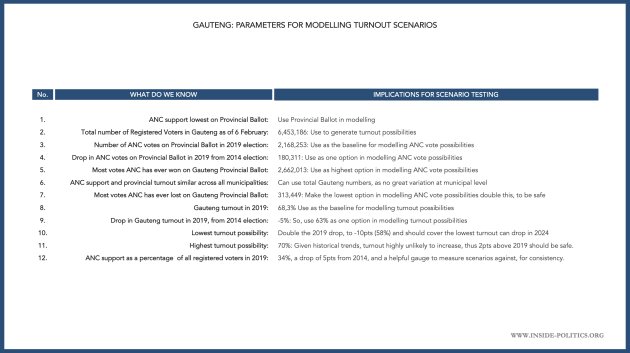
The turnout model appears below, but first here is how it works, using the above.
There is no great variation in either ANC support or turnout at municipal level. So, we can use the Gauteng totals, which makes life much easier.
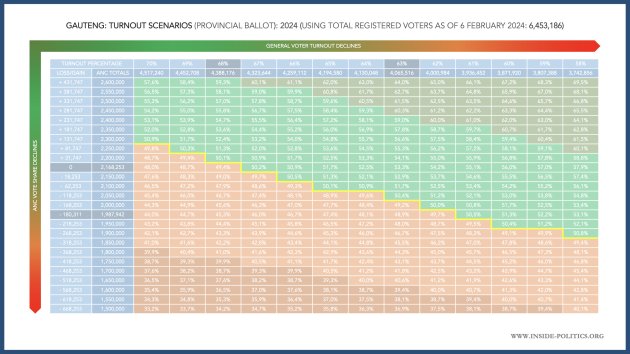
Regards ANC votes, we will give the party a band of around a 1m votes, from 2,6m down to 1,5m, and with its 2019 performance (2,1m) somewhere towards the middle. These run down the left, next to a column showing how many votes lost or gained at that number. The votes increase or decrease in bands of 50,000. That gives us 9 possibilities where the ANC vote increases (2,1m up to 2,6m) and 15 where it decreases (2,1m down to 1,5m). There are more decrease possibilities because history suggests that is more likely to happen.
As for turnout possibilities, we have gone for a range of 13, from 70% to 58%. These run along the top.
These two bands should cover all eventualities. If they don’t, the result of the election will be extraordinary. They include the ANC’s 2019 vote total (2,168,253), as well as the total if it lost the same number of votes as it did in 2019 (1,987,942). And they include the 2019 turnout level (68%), and the level it would be at if it dropped at the same rate it did in 2019 (63%). As well as a lot of space on either side of those.
Perhaps most importantly we have the latest IEC registration numbers for Gauteng: 6,453,186. Using that we can generate the number of voters who would actually vote at each turnout possibility. They appear along the top, below the turnout possibilities.
Finally, we have the outcome – every turnout possibility cross-tabulated against every ANC vote possibility – giving you an ANC percentage for every variation. There are around 350 of them.
Put that all together, and we have our Gauteng Turnout model:
Now we can generate some scenarios.
The solution to the ANC’s problem in Gauteng is, on one level, a very simple one: all it must do is grow. And it doesn’t have to even grow a lot. Just a little.
Our first scenario is a “Good” ANC election. It is illustrated below. Here the ANC grows by just 81,000 votes and turnout stays at 68% (the 2019 level). As a result, not only does the party clear the 50% threshold with 51,3% but if you read across to the right from the intersection, it gets increasingly higher above 50% as turnout drops. So just the smallest growth would go a long, long way for the ANC.
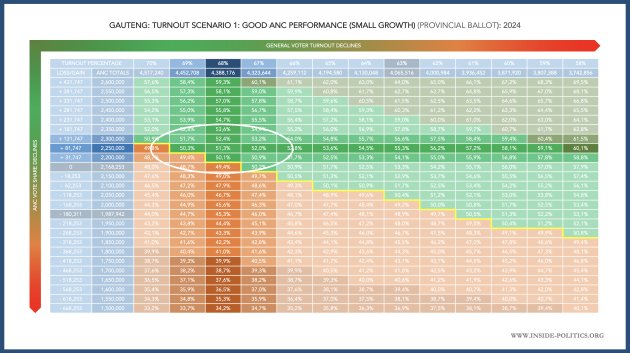
But the available evidence suggests that is an outlier scenario. Historical indicators are all headed downwards and as soon as the ANC loses votes, or even stays stagnant, it gets into trouble.
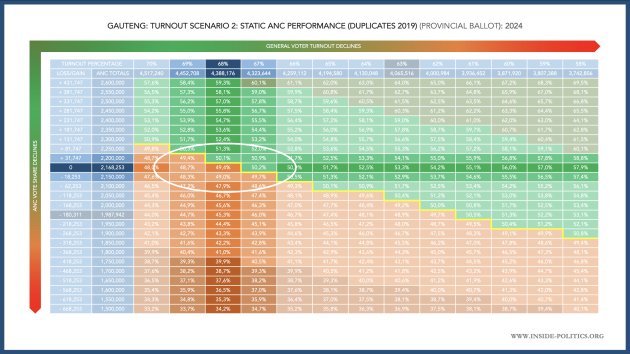
The second scenario, below, shows what would happen if the ANC repeated its 2019 performance exactly – same votes, same turnout. I have called this a “Static” performance. This has the party just below 50%, at 49,4%. True, 50% would be touch and go on the day, but immediately we see that, outside of growth, the ANC is in trouble. From here it only gets worse.
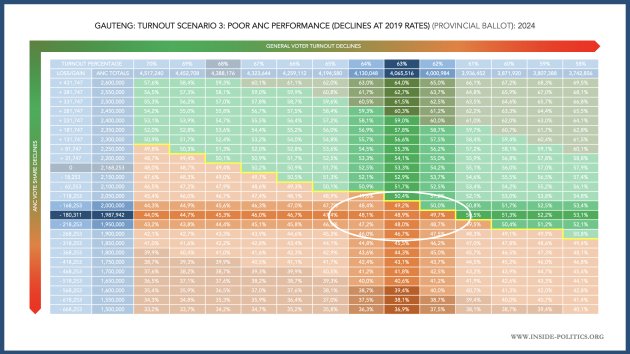
The third scenario is a “Poor” ANC performance, as shown below. Here the party declines at the same rate it did in 2019. It loses 181,000 votes and turnout drops 5pts (as it did in 2019) to 63%. It is still relatively close to the 50% threshold, but all off the first four scenarios assume the opposition performs as it did in 2019.
If the opposition has vaguely good day, maintains the ANC’s 2019 rate of decline but can keep turnout relatively high, to the left of the ANC’s percentage at this scenario are a range of scores steadily deeper into the 40% bracket. And that is the direction it would be moving in at this scenario.
The fourth scenario is a “Bad” ANC performance, as below. Here the party loses roughly double its 2019 vote loss – around 360,000 votes total. This is well within the bounds of what is possible (in 2014 the ANC lost 313,000 votes on the Gauteng provincial ballot). It is also realistic not to drop turnout too much. Gauteng has the highest turnout in the country historically. That must be considered. So, this scenario uses 63% (- 5pts).
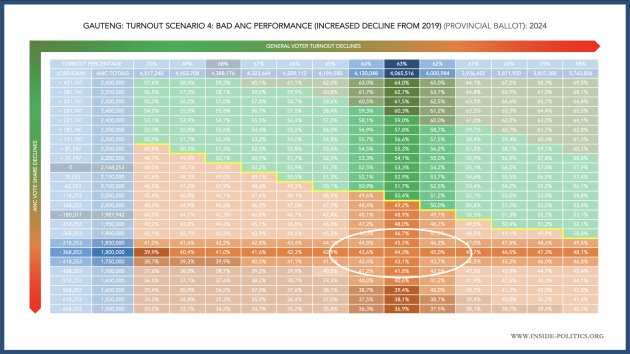
The result is the ANC is deep into the red zone, at around 44%. And both left and right, it is red all the way across. A 360,000-vote loss is not that dramatic. But it plunges ANC support closer to the 40% mark than the 50% mark, and makes turnout almost redundant.
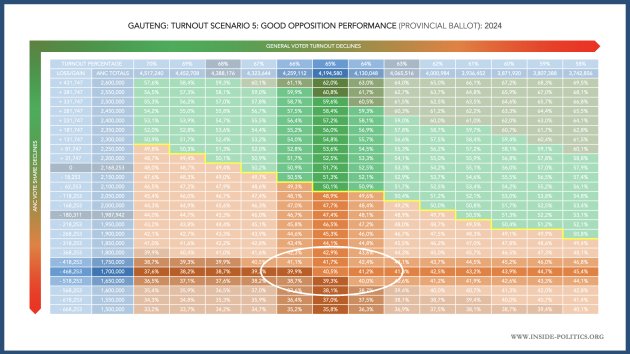
The final scenario is a “Good Opposition” performance, as below. All scenarios up to this point assume nothing more from the collective opposition than what it did in 2019. But if it performs well – if it can get its voters out disproportionately, counter any steep decline in turnout (this scenario uses a 3pt drop to 65%), ANC voters stay away, and the party loses 460,000 votes as a result – then the ANC starts to hit the 40% bracket, and the collapse is total.
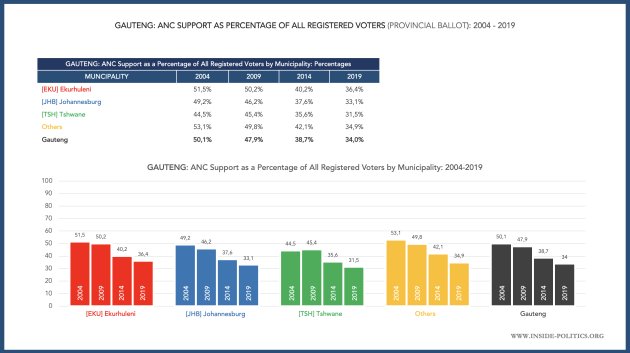
Finally, we can test of these scenarios against the ANC’s support as a percentage of all registered voters (this indicator is a good litmus test for the ANC’s real legitimacy among all voters).
Earlier on we set those numbers out. In Gauteng as a whole, the ANC’s percentage has been steadily dropping, as its core vote base has shrunk, and become worth less and less of the total potential Gauteng voting pool. It has declined as follows:
2004: 50,1%
2009: 47,9%
2014: 38,7%
2019: 34,0%
If this trend holds, the ANC’s percentage of all registered voters should drop to around 29%/30% in 2024, maybe lower (it did drop 9pts in 2014). Here are how our scenarios translate:
Scenario 1 (“Good”): 2,250,000 votes = 34,9%
Scenario 2 (“Static”): 2,168,253 votes = 33,6%
Scenario 3 (“Poor”): 1,987,942 votes = 30,8%
Scenario 4: (“Bad”): 1,800,000 votes = 27,9%
Scenario 5: (“Good Opposition”): 1,700,000 votes: 26,3%
By that measure, Scenarios 1-3 seem less likely. Scenarios 4 and 5 seem more in the realm of what to expect. Perhaps something between 3 and 4?
In closing, some other predictions from Cyril Ramaphosa to help contextualize his current view on Gauteng. From 2021:
Johannesburg: We are looking forward to “an overwhelming victory”. ANC result: 33,6%
Tshwane: I am “not concerned” and am “absolutely certain” the ANC will win. ANC result: 34,6%
Ekurhuleni: I “sense quite a lot of satisfaction with what our metro has been doing here”. ANC result: 38,2%
Nelson Mandela Bay: We feel “very confident that the ANC will regain control of this metro”. ANC result: 39,9%
eThekwini: “We are going to be victorious here, I have no doubt about it”. ANC result: 42,0%
The key takeaways from this analysis are:
The ANC’s vote in Gauteng, on the provincial ballot, is on a knife edge.
The only clear path the ANC has, to retaining control of Gauteng and getting over 50%, is to grow. It needn’t grow by a lot, just 50,000-100,000 votes will make a profound impact on its prospects.
That is an outlier scenario, however, least of all because it would require ANC voters to believe the ANC’s performance as a party and in government has improved over the last five years. There are no market research findings that indicate this is the case.
However, if the ANC stays stable or declines by no more than it did in 2019, it will become exceptionally hard for it to perform better than 50%. In turn, to ensure such a scenario translated into 50% or more for the ANC, the opposition would have to perform relatively poorly.
If the ANC declines anything more than it did in 2019, 50% becomes almost unreachable. It does not take many votes lost for this to become true. Just 300,000 votes lost would see it win around 45% and render turnout redundant.
If the opposition can perform, to grow its collective vote share (thus the ANC’s declines) and to turn out in enough numbers not to see turnout drop too far, it can drive the ANC vote share all the way down to the 40% mark.
The greatest weapon in the opposition’s favour is turnout. Gauteng had the highest turnout levels in 2019, mostly driven by the opposition. If it can merely replicate or outperform 2019, it will make the ANC’s job almost impossible.
All numbers in this essay are drawn from the Independent Electoral Commission website: https://www.elections.org.za/pw/
This essay is the 10th in an on-going series on Election 2024, for all other editions of this series, please click here: Election 2024
