
REPORT ON WEEKLY DEATHS IN SOUTH AFRICA
3 -16 JANUARY 2021 (WEEKS 1&2)
Debbie Bradshaw, Ria Laubscher,
Rob Dorrington, Pam Groenewald, Tom Moultrie
Burden of Disease Research Unit South African Medical Research Council
23 January 2021
Glossary:
Actual number of deaths: The actual number of deaths in South Africa have been estimated from the numbers recorded on the National Population Register using weighting factors set to produce results consistent with those of the annual Rapid Mortality Surveillance Report to account for deaths of persons who are not on the National Population Register as well as those that have not been registered with the Department of Home Affairs. The adjustments to account for incompleteness of recording of deaths on the NPR have been re-estimated for the 2021 reports taking into account the 2017 cause-of-death data released by Stats SA in 2020. A methodological note briefly outlining the changes can be downloaded with this report from the SAMRC website: https://www.samrc.ac.za/reports/report-weekly-deaths-south-africa.
Epi-week: The Weekly Death Reports in 2020 used weeks from 1 January and ran from Wednesday to Tuesday. In setting up the monitoring for 2021, we recast the data to report by an ‘Epi-week’ consistent with CDC and many NICD reports which run from Sunday to Saturday, ensuring continuity of weeks from one year to the next. Each week is aligned with the ‘Epi-year’ that has 4 of more days in that week. Week 53 of 2020 is from 27 December 2020 to 2 January 2021 and Week 1 of 2021 is 3 January – 9 January 2021.
Excess deaths: There is no universal definition of, or understanding of what is meant by, “excess mortality”. It is a term used in epidemiology and public health that refers to the number of deaths that are occurring above what we would normally expect. The WHO uses the term to describe “Mortality above what would be expected based on the non-crisis mortality rate in the population of interest. Excess mortality is thus mortality that is attributable to the crisis conditions. It can be expressed as a rate (the difference between observed and non-crisis mortality rates), or as a total number of excess deaths.”
Excess natural deaths associated with COVID-19: Generally, the number of excess deaths per week is calculated as the number of all-cause deaths in that week less the number that might be assumed to have occurred had there not been the epidemic (i.e. the counterfactual number), provided that the counterfactual is lower. However, this approach has generally only been applied to countries where deaths have been tracking the counterfactual before the onset of significant numbers of COVID-19 related deaths.
The method provides a poor estimate of the numbers of COVID-19 and collateral deaths in the early stages of the epidemic when this is not the case. Thus, we estimated the numbers of COVID and collateral deaths, once a clear upward trend is evident, as the number of actual deaths less a baseline number determined as a proportion of the predicted number. By the end of the 1st wave of the pandemic, the predicted values have been used as the counterfactual.
***
Warning: The Department of Home Affairs has faced sporadic temporary office closures, particularly in areas that are more affected by COVID-19. This may affect our allocation of a death to a metro area. For example, a death that occurred in the City of Cape Town might have been registered at an office outside of the City because of a temporary closure. Closure may also cause a delay in the processing of the death registration which would result in an underestimate of the deaths in the most recent week. This accounts for the kinks in what should otherwise be a smooth increase in numbers of deaths in Cape Town and Buffalo, for example.
***
Background
This report provides estimates of the weekly number of deaths of person 1+ years in South Africa for Week 1 and 2 of 2021, covering the 2-week period to 16 January 2021.
While preparing predicted numbers of weekly deaths for 2021, enhancements have been made to the estimation process. The estimates now take into account the release of vital registration data to include registrations up to the close of 2017. They also ensure that the national estimate of excess deaths is consistent with the sum of the estimates for the provinces. Reporting has changed to ‘Epi-weeks’ that run from Sunday to Saturday which will align with other weekly reports and enable us to lessen the lag in reporting.
The main methodological change introduced in the 2021 reporting is that death data for the period 2014-2019 have been used to estimate the trend in mortality and the weekly variations to provide predicted values for 2020 and 2021, rather than using data for 2018 and 2019 as was done for 2020 estimates. After reviewing trends in the data, separate negative binomial models have been fitted to the unnatural deaths, the natural deaths for KwaZulu-Natal, the natural deaths for Western Cape and for natural deaths for the 7 other provinces to provide estimates by age, sex and epi-week for each year.
A prediction interval has been estimated on the basis of the variability in the observed weekly data for each reported domain. The data for both 2020 and 2021 have been recast and both years will be reported with a cumulative total of excess deaths taken from the 3 May 2020, considered to be the starting point of excess deaths associated with the COVID-19 pandemic in South Africa.
Except for KwaZulu-Natal (and eThekwini in particular) the impact of the changes is relatively small. The time-series approach using data from 2018 and 2019 is used for the metropolitan areas as the trends in the sub-provincial data need further investigation to develop a comprehensive district-level model.
A brief methodological note outlining the changes that have been made for monitoring deaths during 2021 can be downloaded with this report from the SAMRC website as well as a spreadsheet with estimated values: https://www.samrc.ac.za/reports/report-weekly-deaths-south-africa.
Trends
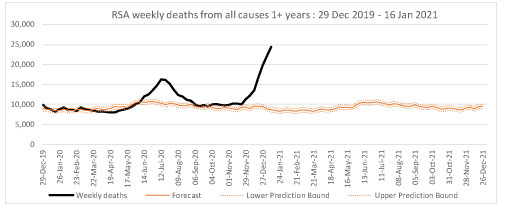
- The weekly number of deaths of persons 1+ years of age from all causes increased throughout the months of December and January. There were 22,194 deaths from all causes in the Week 1 (3 – 9 Jan 2021) which increased to 24,469 in Week 2 (10 -16 Jan 2021).
- During Week 1 (3 – 9 Jan 2021) there were 13,766 excess deaths of persons 1+ years from natural causes, which increased to 16,093 in the Week 2 (10 -16 Jan 2021). The weekly numbers of excess natural deaths have reached more than double the highest number of excess natural deaths of 6,673 that was experienced during the 1st wave of the pandemic in Week 30 (19 -27 Jul 2020).
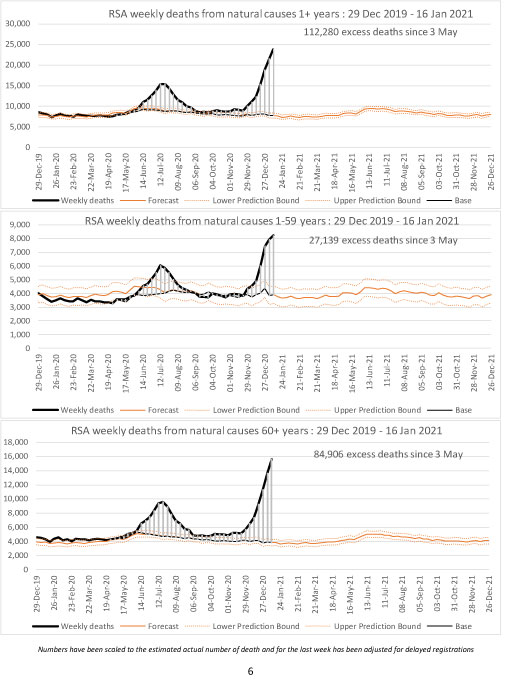
- By the end of Week 2, spanning the period 3 May 2020 – 16 Jan 2021, there had been a total of 112,280 excess deaths from natural causes of persons 1+ years of age. By the end of Week 53 of 2020, for the period 3 May 2020 – 2 Jan 2021, there had been a total of 82,102 which increased to 95,867 by the end of Week 1 (9 Jan 2021). Our previous report on weekly deaths, released on 11 January 2021, reported that the number of excess deaths reported for the period 3 May 2020 – 5 Jan 2021 was 83,918, highlighting good correspondence at the national level between the old and new methods.
- For people 1-59 years the excess natural deaths since 3 May 2020 is 27,139 and 84,906 for people 60+ years.
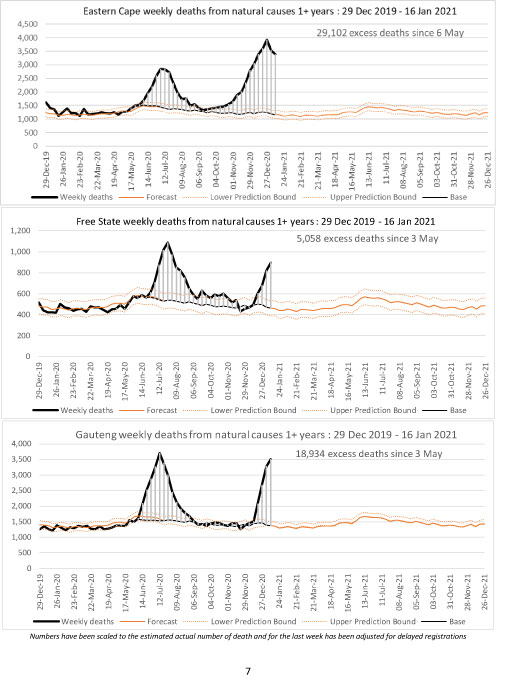
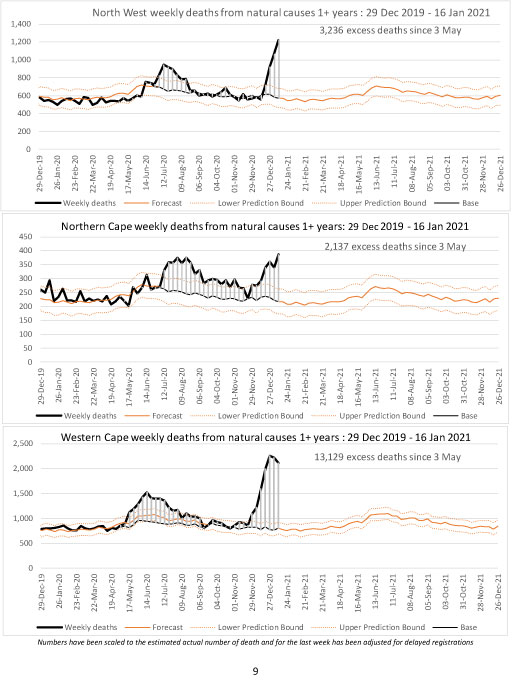
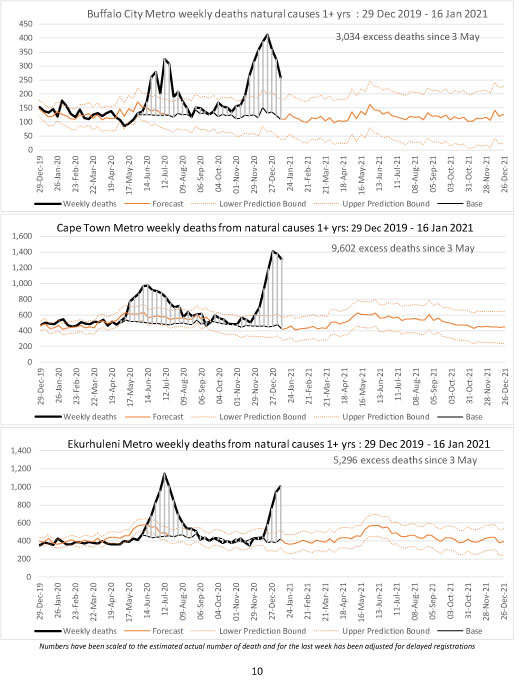
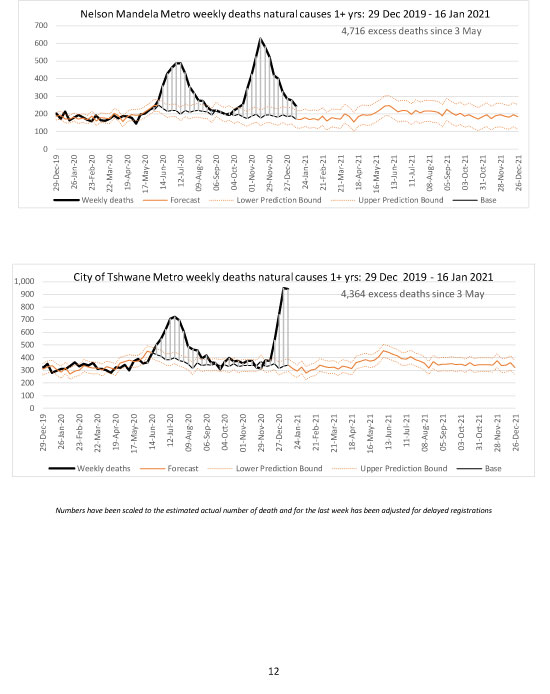
- The number of deaths 1+ years from natural causes in the Eastern Cape has turned and is decreasing. The province has experienced a total excess of 29,102 excess deaths by the end of Week 2 (16 Jan 2021). The peak number of weekly deaths in the 2nd wave occurred in Week 53 (27 Dec 2020 – 2 Jan 2021) and was considerably higher (2,413) than the number of excess natural deaths that occurred in the peak of the 1st wave in the province (1,436). Natural deaths in 2nd wave in Nelson Mandela Bay have continued to decrease and have reached a level within the prediction bounds. The number of deaths in Buffalo City have also decreased but are still above the upper prediction bound.
- The number of deaths from natural causes in the Western Cape peaked during Week 53 of 2020 (27 Dec 2020-2 Jan 2021) with 1,480 excess deaths and has started decreasing. By the end of Week 2, the province had experienced a cumulative total of 13,129 excess deaths of person 1+ years and older from natural causes in the period 3 May 2020 – 16 Jan 2021. The natural deaths in the City of Cape Town has also started to decrease rapidly with the peak in the 2nd wave being about 40% higher than the peak in the 1st wave.
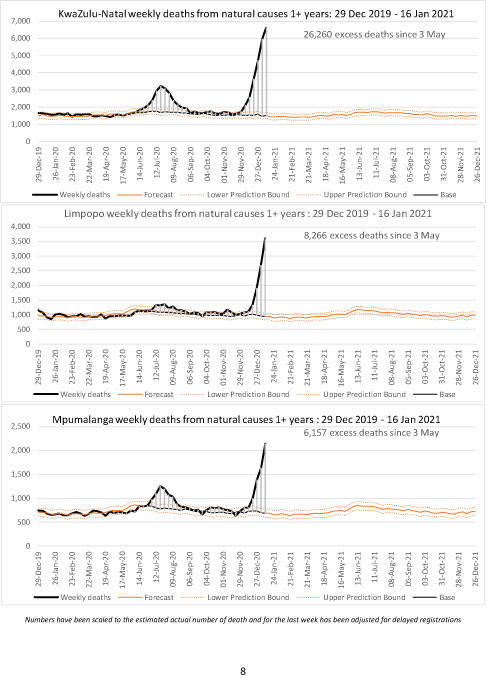
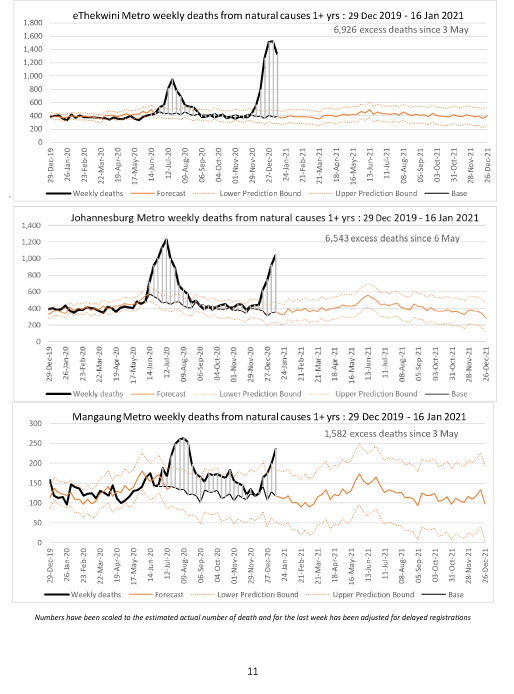
- The number of deaths from natural causes in the KwaZulu-Natal has continued to increase but at a slightly slower rate in the past week. The number of excess natural deaths in Week 2 (11 – 16 Jan 2021) reaching a record high of 5,070 excess natural deaths and was more than double the peak of the 1st wave of 1,543 deaths. By the end of Week 2 (16 Jan 2021) the province had experienced a total excess of 26,260 since 3 May 2020. The number of deaths from natural causes in eThekwini has turned reaching a high of 1,146 excess natural deaths during Week 1 (3 – 10 Jan 2021), more than double the peak of the 1st wave in Week 30 of 2020 when there were 523 excess deaths.
- The increase in the number of deaths from natural causes in the Gauteng has slowed down slightly in Week 2 (10 -16 Jan 2021), with a cumulative excess of 18,934 deaths by 16 Jan 2021. While Johannesburg and Ekurhuleni are still increasing, it is possible that Tshwane has reached its peak by Week 2 (10 -16 Jan 2021).
- Deaths from natural causes have been increasing in all the other provinces. Extremely sharp increases in the number of natural deaths have been experienced in Limpopo and Mpumalanga during December and January. During Week 2, Limpopo experienced an excess of 2,270 deaths and Mpumalanga an excess of 1,305 natural deaths.
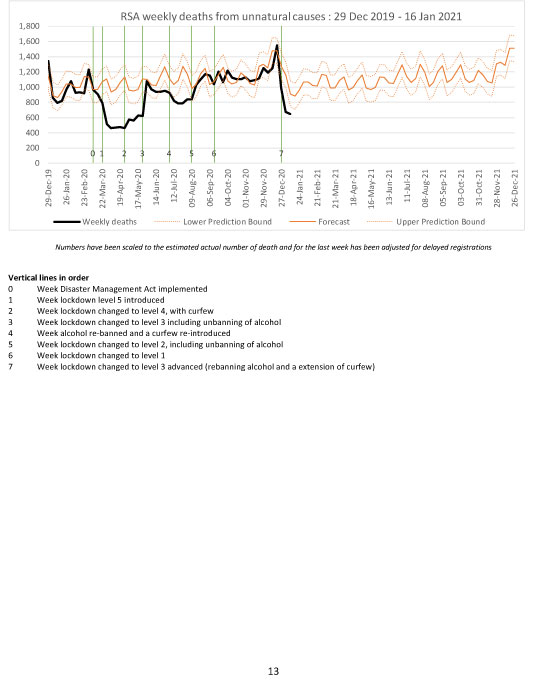
- The weekly number of deaths from unnatural causes in Week 2 (10 -16 Jan 2021) has dropped below the prediction interval.
Numbers have been scaled to the estimated actual number of death and for the last week has been adjusted for delayed registrations
Table 1: Number of excess natural deaths of persons 1+ years by province and metro relative to revised predicted number based on the observed drop during lockdown, South Africa 2020
|
Region |
Period |
Excess deaths vs revised base |
|
South Africa |
3 May 20 – 16 Jan 21 |
112,280 |
|
Province |
|
|
|
Eastern Cape |
31 May 20 – 16 Jan 21 |
29,102 |
|
Free State |
21 Jun 20 – 16 Jan 21 |
5,058 |
|
Gauteng |
7 Jun 20 – 16 Jan 21 |
18,934 |
|
KwaZulu-Natal |
7 Jun 20 – 16 Jan 21 |
26,260 |
|
Limpopo |
21 Jun 20 – 16 Jan 21 |
8,266 |
|
Mpumalanga |
21 Jun 20 – 16 Jan 21 |
6,157 |
|
Northern Cape |
28 Jun 20 – 16 Jan 21 |
2,137 |
|
North West |
28 Jun 20 – 16 Jan 21 |
3,236 |
|
Western Cape |
3 May 20 – 16 Jan 21 |
13,129 |
|
Metropolitan Municipality |
|
|
|
Buffalo City |
31 May 20 – 16 Jan 21 |
3,034 |
|
City of Cape Town |
3 May 20 – 16 Jan 21 |
9,602 |
|
Ekurhuleni |
7 Jun 20 – 16 Jan 21 |
5,296 |
|
eThekwini |
14 Jun 20 – 16 Jan 21 |
6,926 |
|
Johannesburg |
7 Jun 20 – 16 Jan 21 |
6,543 |
|
Mangaung |
21 Jun 20 – 16 Jan 21 |
1,582 |
|
Nelson Mandela Bay |
28 May 20 – 16 Jan 21 |
4,716 |
|
City of Tshwane |
7 Jun 20 – 16 Jan 21 |
4,364 |
Note: Period has been determined based on when an upturn in the number of natural deaths became apparent. Parts do not sum to the whole because office closures due to Covid-19 may have led to registration of deaths at other offices which may not be in the same area, and random fluctuation at the point at which the baseline is determined.
Table 2: Number of excess deaths from all causes of persons 1+ years by province and metro relative to predicted number based on historical trend, South Africa 2020
|
Region |
Excess deaths vs forecast |
|
South Africa |
106,787 |
|
Province |
|
|
Eastern Cape |
29,315 |
|
Free State |
4,870 |
|
Gauteng |
16,916 |
|
KwaZulu-Natal |
25,745 |
|
Limpopo |
7,961 |
|
Mpumalanga |
5,771 |
|
Northern Cape |
2,041 |
|
North West |
2,994 |
|
Western Cape |
11,176 |
|
Metropolitan Municipality |
|
|
Buffalo City |
2,608 |
|
City of Cape Town |
7,426 |
|
Ekurhuleni |
4,977 |
|
eThekwini |
6,927 |
|
Johannesburg |
5,433 |
|
Mangaung |
1,725 |
|
Nelson Mandela Bay |
4,654 |
|
City of Tshwane |
4,089 |
***
***
***
***
***
***
***
Issued by the SAMRC, 25 January 2021
